UPS 2012 Annual Report Download - page 49
Download and view the complete annual report
Please find page 49 of the 2012 UPS annual report below. You can navigate through the pages in the report by either clicking on the pages listed below, or by using the keyword search tool below to find specific information within the annual report.-
 1
1 -
2
-
3
-
4
-
5
-
6
-
7
-
8
-
9
-
10
-
11
-
12
-
13
-
14
-
15
-
16
-
17
-
18
-
19
-
20
-
21
-
22
-
23
-
24
-
25
-
26
-
27
-
28
-
29
-
30
-
31
-
32
-
33
-
34
-
35
-
36
-
37
-
38
-
 39
39 -
 40
40 -
 41
41 -
 42
42 -
 43
43 -
 44
44 -
 45
45 -
 46
46 -
 47
47 -
 48
48 -
 49
49 -
 50
50 -
 51
51 -
 52
52 -
 53
53 -
 54
54 -
 55
55 -
 56
56 -
 57
57 -
 58
58 -
 59
59 -
60
-
61
-
62
-
63
-
64
-
65
-
66
-
67
-
68
-
69
-
70
-
71
-
72
-
73
-
74
-
75
-
76
-
77
-
78
-
79
-
80
-
81
-
82
-
83
-
84
-
85
-
86
-
87
-
88
-
89
-
90
-
91
-
92
-
93
-
94
-
95
-
96
-
97
-
98
-
99
-
100
-
101
-
102
-
103
-
104
-
105
-
106
-
107
-
108
-
109
-
110
-
111
-
112
-
113
-
114
-
115
-
116
-
117
-
118
-
119
-
120
-
121
-
122
-
123
-
124
-
125
-
126
-
127
 |
 |

UNITED PARCEL SERVICE, INC. AND SUBSIDIARIES
MANAGEMENT'S DISCUSSION AND ANALYSIS OF FINANCIAL CONDITION AND
RESULTS OF OPERATIONS
37
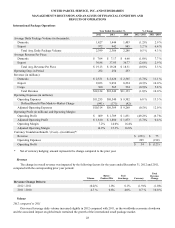
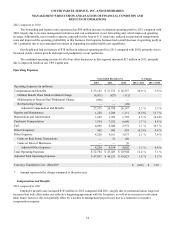
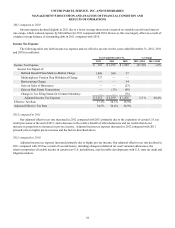
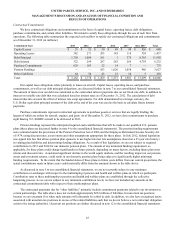
Other Expenses
2012 compared to 2011
Adjusted other expenses increased in 2012 compared with 2011, primarily due to an increase in transportation equipment
rentals, bad debt expense and auto liability insurance, as well as expenses incurred in 2012 related to the proposed TNT
Express N.V. acquisition. These increases were partially offset by a reduction in employee relocation expenses and a decline in
package claims expense. Additionally, 2012 adjusted other expenses were reduced by a $9 million gain on the sale of a
distribution facility in our Supply Chain & Freight segment.
2011 compared to 2010
The increase in adjusted other expenses in 2011 compared with 2010 was caused by several factors, including foreign
currency remeasurement losses, advertising costs, employee expense reimbursements, equipment rentals, air cargo handling
costs and data processing fees. These increases were partially offset by a reduction in bad debt and employee relocation
expenses.
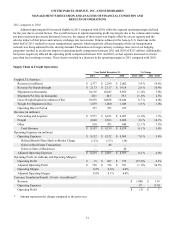
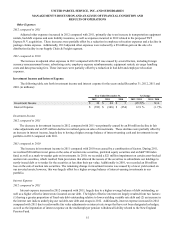
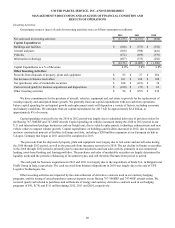
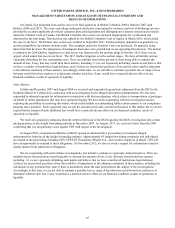
Investment Income and Interest Expense
The following table sets forth investment income and interest expense for the years ended December 31, 2012, 2011 and
2010 (in millions):
Year Ended December 31, % Change
2012 2011 2010 2012 / 2011 2011 / 2010
Investment Income $ 24 $ 44 $ 3 (45.5)% N/A
Interest Expense $ (393) $ (348) $ (354) 12.9 % (1.7)%
Investment Income
2012 compared to 2011
The decrease in investment income in 2012 compared with 2011 was primarily caused by an $8 million decline in fair
value adjustments and an $25 million decline in realized gains on sales of investments. These declines were partially offset by
an increase in interest income, largely due to having a higher average balance of interest-earning cash and investments in our
portfolio in 2012 compared with 2011.
2011 compared to 2010
The increase in investment income in 2011 compared with 2010 was caused by a combination of factors. During 2011,
we realized $20 million in net gains on the sales of auction rate securities, preferred equity securities and an S&P 500 index
fund, as well as a mark-to-market gain on investments. In 2010, we recorded a $21 million impairment on certain asset-backed
auction rate securities, which resulted from provisions that allowed the issuers of the securities to subordinate our holdings to
newly-issued debt or to tender for the securities at less than their par value. Additionally in 2010, we recorded an $8 million
loss on the sale of auction rate securities. The remaining change in investment income was caused by a lower yield earned on
our invested assets; however, this was largely offset by a higher average balance of interest-earning investments in our
portfolio.
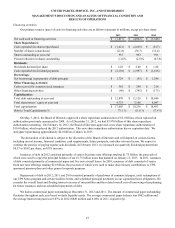
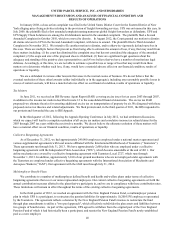
Interest Expense
2012 compared to 2011
Interest expense increased in 2012 compared with 2011, largely due to a higher average balance of debt outstanding, as
well as a higher effective interest rate incurred on our debt. The higher effective interest rate largely resulted from two factors:
(1) having a greater proportion of fixed-rate debt outstanding relative to lower-yielding variable rate debt and (2) an increase in
the interest rate indices underlying our variable-rate debt and swaps in 2012. Additionally, interest expense increased in 2012
compared with 2011 due to unfavorable fair value adjustments on interest rate swaps that have not been designated as hedges,
as well as the imputation of interest expense on the multiemployer pension withdrawal liability related to the New England
Pension Fund.