UPS 2012 Annual Report Download - page 40
Download and view the complete annual report
Please find page 40 of the 2012 UPS annual report below. You can navigate through the pages in the report by either clicking on the pages listed below, or by using the keyword search tool below to find specific information within the annual report.-
 1
1 -
2
-
3
-
4
-
5
-
6
-
7
-
8
-
9
-
10
-
11
-
12
-
13
-
14
-
15
-
16
-
17
-
18
-
19
-
20
-
21
-
22
-
23
-
24
-
25
-
26
-
27
-
28
-
29
-
 30
30 -
 31
31 -
 32
32 -
 33
33 -
 34
34 -
 35
35 -
 36
36 -
 37
37 -
 38
38 -
 39
39 -
 40
40 -
 41
41 -
 42
42 -
 43
43 -
 44
44 -
 45
45 -
 46
46 -
 47
47 -
 48
48 -
 49
49 -
 50
50 -
51
-
52
-
53
-
54
-
55
-
56
-
57
-
58
-
59
-
60
-
61
-
62
-
63
-
64
-
65
-
66
-
67
-
68
-
69
-
70
-
71
-
72
-
73
-
74
-
75
-
76
-
77
-
78
-
79
-
80
-
81
-
82
-
83
-
84
-
85
-
86
-
87
-
88
-
89
-
90
-
91
-
92
-
93
-
94
-
95
-
96
-
97
-
98
-
99
-
100
-
101
-
102
-
103
-
104
-
105
-
106
-
107
-
108
-
109
-
110
-
111
-
112
-
113
-
114
-
115
-
116
-
117
-
118
-
119
-
120
-
121
-
122
-
123
-
124
-
125
-
126
-
127
 |
 |

UNITED PARCEL SERVICE, INC. AND SUBSIDIARIES
MANAGEMENT'S DISCUSSION AND ANALYSIS OF FINANCIAL CONDITION AND
RESULTS OF OPERATIONS
28
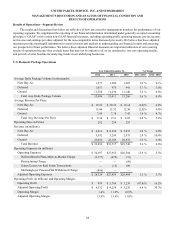
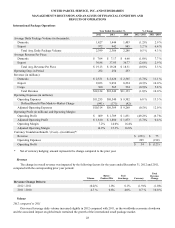
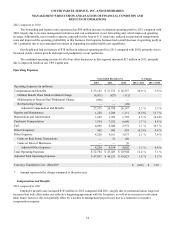
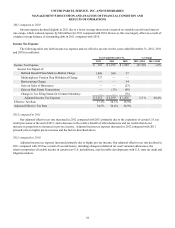
International Package Operations
Year Ended December 31, % Change
2012 2011 2010 2012 / 2011 2011 / 2010
Average Daily Package Volume (in thousands):
Domestic 1,427 1,444 1,403 (1.2)% 2.9 %
Export 972 942 885 3.2 % 6.4 %
Total Avg. Daily Package Volume 2,399 2,386 2,288 0.5 % 4.3 %
Average Revenue Per Piece:
Domestic $ 7.04 $ 7.17 $ 6.66 (1.8)% 7.7 %
Export 36.88 37.85 36.77 (2.6)% 2.9 %
Total Avg. Revenue Per Piece $ 19.13 $ 19.28 $ 18.31 (0.8)% 5.3 %
Operating Days in Period 252 254 253
Revenue (in millions):
Domestic $ 2,531 $ 2,628 $ 2,365 (3.7)% 11.1 %
Export 9,033 9,056 8,234 (0.3)% 10.0 %
Cargo 560 565 534 (0.9)% 5.8 %
Total Revenue $12,124 $12,249 $11,133 (1.0)% 10.0 %
Operating Expenses (in millions):
Operating Expenses $11,255 $10,540 $ 9,302 6.8 % 13.3 %
Defined Benefit Plan Mark-to-Market Charge (941)(171)(42)
Adjusted Operating Expenses $10,314 $10,369 $ 9,260 (0.5)% 12.0 %
Operating Profit (in millions) and Operating Margin:
Operating Profit $ 869 $ 1,709 $ 1,831 (49.2)% (6.7)%
Adjusted Operating Profit $ 1,810 $ 1,880 $ 1,873 (3.7)% 0.4 %
Operating Margin 7.2% 14.0% 16.4%
Adjusted Operating Margin 14.9% 15.3% 16.8%
Currency Translation Benefit / (Cost)—(in millions)*:
Revenue $ (231) $ 75
Operating Expenses 265 (198)
Operating Profit $ 34 $ (123)
* Net of currency hedging; amount represents the change compared to the prior year.
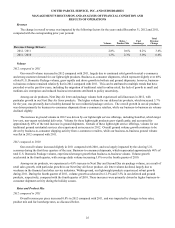
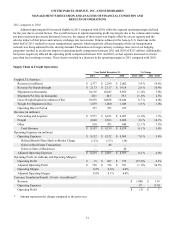
Revenue
The change in overall revenue was impacted by the following factors for the years ended December 31, 2012 and 2011,
compared with the corresponding prior year periods:
Volume
Rates /
Product Mix
Fuel
Surcharge Currency
Total
Revenue
Change
Revenue Change Drivers:
2012 / 2011 (0.2)% 1.0% 0.1% (1.9)% (1.0)%
2011 / 2010 4.7 % 0.6% 4.0% 0.7 % 10.0 %
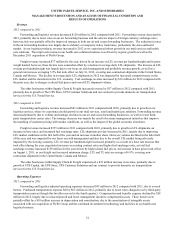
Volume
2012 compared to 2011
Our overall average daily volume increased slightly in 2012 compared with 2011, as the worldwide economic slowdown
and the associated impact on global trade restrained the growth of the international small package market.