UPS 2012 Annual Report Download - page 105
Download and view the complete annual report
Please find page 105 of the 2012 UPS annual report below. You can navigate through the pages in the report by either clicking on the pages listed below, or by using the keyword search tool below to find specific information within the annual report.-
 1
1 -
2
-
3
-
4
-
5
-
6
-
7
-
8
-
9
-
10
-
11
-
12
-
13
-
14
-
15
-
16
-
17
-
18
-
19
-
20
-
21
-
22
-
23
-
24
-
25
-
26
-
27
-
28
-
29
-
30
-
31
-
32
-
33
-
34
-
35
-
36
-
37
-
38
-
39
-
40
-
41
-
42
-
43
-
44
-
45
-
46
-
47
-
48
-
49
-
50
-
51
-
52
-
53
-
54
-
55
-
56
-
57
-
58
-
59
-
60
-
61
-
62
-
63
-
64
-
65
-
66
-
67
-
68
-
69
-
70
-
71
-
72
-
73
-
74
-
75
-
76
-
77
-
78
-
79
-
80
-
81
-
82
-
83
-
84
-
85
-
86
-
87
-
88
-
89
-
90
-
91
-
92
-
93
-
94
-
 95
95 -
 96
96 -
 97
97 -
 98
98 -
 99
99 -
 100
100 -
 101
101 -
 102
102 -
 103
103 -
 104
104 -
 105
105 -
 106
106 -
 107
107 -
 108
108 -
 109
109 -
 110
110 -
 111
111 -
 112
112 -
 113
113 -
 114
114 -
 115
115 -
116
-
117
-
118
-
119
-
120
-
121
-
122
-
123
-
124
-
125
-
126
-
127
 |
 |

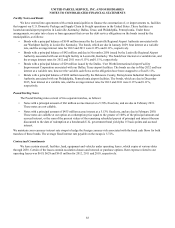
UNITED PARCEL SERVICE, INC. AND SUBSIDIARIES
NOTES TO CONSOLIDATED FINANCIAL STATEMENTS
93
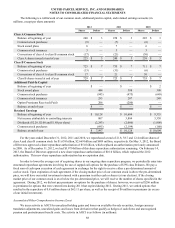
In evaluating financial performance, we focus on operating profit as a segment’s measure of profit or loss. Operating
profit is before investment income, interest expense and income taxes. The accounting policies of the reportable segments are
the same as those described in the summary of accounting policies (see note 1), with certain expenses allocated between the
segments using activity-based costing methods. Unallocated assets are comprised primarily of cash, marketable securities, and
certain investment partnerships.
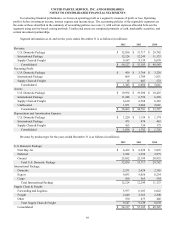
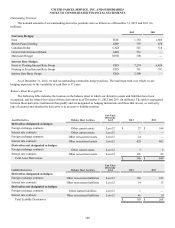
Segment information as of, and for the years ended, December 31 is as follows (in millions):
2012 2011 2010
Revenue:
U.S. Domestic Package $ 32,856 $ 31,717 $ 29,742
International Package 12,124 12,249 11,133
Supply Chain & Freight 9,147 9,139 8,670
Consolidated $ 54,127 $ 53,105 $ 49,545
Operating Profit:
U.S. Domestic Package $ 459 $ 3,764 $ 3,238
International Package 869 1,709 1,831
Supply Chain & Freight 15 607 572
Consolidated $ 1,343 $ 6,080 $ 5,641
Assets:
U.S. Domestic Package $ 19,934 $ 19,300 $ 18,425
International Package 11,248 6,729 6,228
Supply Chain & Freight 6,610 6,588 6,283
Unallocated 1,071 2,084 2,661
Consolidated $ 38,863 $ 34,701 $ 33,597
Depreciation and Amortization Expense:
U.S. Domestic Package $ 1,220 $ 1,154 $ 1,174
International Package 475 474 443
Supply Chain & Freight 163 154 175
Consolidated $ 1,858 $ 1,782 $ 1,792
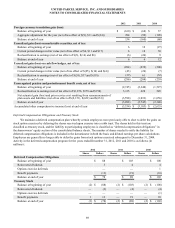
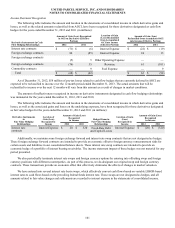
Revenue by product type for the years ended December 31 is as follows (in millions):
2012 2011 2010
U.S. Domestic Package:
Next Day Air $ 6,412 $ 6,229 $ 5,835
Deferred 3,392 3,299 2,975
Ground 23,052 22,189 20,932
Total U.S. Domestic Package 32,856 31,717 29,742
International Package:
Domestic 2,531 2,628 2,365
Export 9,033 9,056 8,234
Cargo 560 565 534
Total International Package 12,124 12,249 11,133
Supply Chain & Freight:
Forwarding and Logistics 5,977 6,103 6,022
Freight 2,640 2,563 2,208
Other 530 473 440
Total Supply Chain & Freight 9,147 9,139 8,670
Consolidated $ 54,127 $ 53,105 $ 49,545