UPS 2012 Annual Report Download - page 50
Download and view the complete annual report
Please find page 50 of the 2012 UPS annual report below. You can navigate through the pages in the report by either clicking on the pages listed below, or by using the keyword search tool below to find specific information within the annual report.-
 1
1 -
2
-
3
-
4
-
5
-
6
-
7
-
8
-
9
-
10
-
11
-
12
-
13
-
14
-
15
-
16
-
17
-
18
-
19
-
20
-
21
-
22
-
23
-
24
-
25
-
26
-
27
-
28
-
29
-
30
-
31
-
32
-
33
-
34
-
35
-
36
-
37
-
38
-
39
-
 40
40 -
 41
41 -
 42
42 -
 43
43 -
 44
44 -
 45
45 -
 46
46 -
 47
47 -
 48
48 -
 49
49 -
 50
50 -
 51
51 -
 52
52 -
 53
53 -
 54
54 -
 55
55 -
 56
56 -
 57
57 -
 58
58 -
 59
59 -
 60
60 -
61
-
62
-
63
-
64
-
65
-
66
-
67
-
68
-
69
-
70
-
71
-
72
-
73
-
74
-
75
-
76
-
77
-
78
-
79
-
80
-
81
-
82
-
83
-
84
-
85
-
86
-
87
-
88
-
89
-
90
-
91
-
92
-
93
-
94
-
95
-
96
-
97
-
98
-
99
-
100
-
101
-
102
-
103
-
104
-
105
-
106
-
107
-
108
-
109
-
110
-
111
-
112
-
113
-
114
-
115
-
116
-
117
-
118
-
119
-
120
-
121
-
122
-
123
-
124
-
125
-
126
-
127
 |
 |

UNITED PARCEL SERVICE, INC. AND SUBSIDIARIES
MANAGEMENT'S DISCUSSION AND ANALYSIS OF FINANCIAL CONDITION AND
RESULTS OF OPERATIONS
38
2011 compared to 2010
Interest expense declined slightly in 2011 due to a lower average interest rate incurred on variable rate debt and interest
rate swaps, which reduced expense by $60 million for 2011 compared with 2010. However, this was largely offset as a result of
a higher average balance of outstanding debt in 2011 compared with 2010.
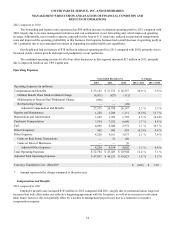
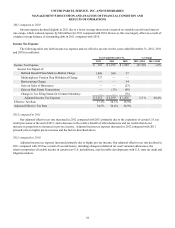
Income Tax Expense
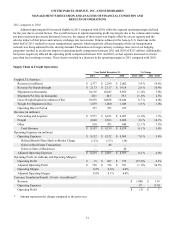
The following table sets forth income tax expense and our effective tax rate for the years ended December 31, 2012, 2011
and 2010 (in millions):
Year Ended December 31, % Change
2012 2011 2010 2012 / 2011 2011 / 2010
Income Tax Expense $ 167 $ 1,972 $ 1,952 (91.5)% 1.0%
Income Tax Impact of:
Defined Benefit Plans Mark-to-Market Charge 1,808 300 37
Multiemployer Pension Plan Withdrawal Charge 337 — —
Restructuring Charge — — 34
Gain on Sales of Businesses — — (23)
Gain on Real Estate Transactions — (13)(48)
Change in Tax Filing Status for German Subsidiary — — (76)
Adjusted Income Tax Expense $ 2,312 $ 2,259 $ 1,876 2.3 % 20.4%
Effective Tax Rate 17.1% 34.1% 36.9%
Adjusted Effective Tax Rate 34.5% 34.4% 34.9%
2012 compared to 2011
Our adjusted effective tax rate increased in 2012 compared with 2011 primarily due to the expiration of certain U.S. tax
credit provisions at the end of 2011, and a decrease in the relative benefit of other deductions and tax credits that do not
increase in proportion to increases in pre-tax income. Adjusted income tax expense increased in 2012 compared with 2011
primarily due to higher pre-tax income and the factors described above.
2011 compared to 2010
Adjusted income tax expense increased primarily due to higher pre-tax income. Our adjusted effective tax rate declined in
2011 compared with 2010 as a result of several factors, including changes in deferred tax asset valuation allowances, the
relative proportion of taxable income in certain non-U.S. jurisdictions, and favorable developments with U.S. state tax audit and
litigation matters.