UPS 2012 Annual Report Download - page 77
Download and view the complete annual report
Please find page 77 of the 2012 UPS annual report below. You can navigate through the pages in the report by either clicking on the pages listed below, or by using the keyword search tool below to find specific information within the annual report.-
 1
1 -
2
-
3
-
4
-
5
-
6
-
7
-
8
-
9
-
10
-
11
-
12
-
13
-
14
-
15
-
16
-
17
-
18
-
19
-
20
-
21
-
22
-
23
-
24
-
25
-
26
-
27
-
28
-
29
-
30
-
31
-
32
-
33
-
34
-
35
-
36
-
37
-
38
-
39
-
40
-
41
-
42
-
43
-
44
-
45
-
46
-
47
-
48
-
49
-
50
-
51
-
52
-
53
-
54
-
55
-
56
-
57
-
58
-
59
-
60
-
61
-
62
-
63
-
64
-
65
-
66
-
 67
67 -
 68
68 -
 69
69 -
 70
70 -
 71
71 -
 72
72 -
 73
73 -
 74
74 -
 75
75 -
 76
76 -
 77
77 -
 78
78 -
 79
79 -
 80
80 -
 81
81 -
 82
82 -
 83
83 -
 84
84 -
 85
85 -
 86
86 -
 87
87 -
88
-
89
-
90
-
91
-
92
-
93
-
94
-
95
-
96
-
97
-
98
-
99
-
100
-
101
-
102
-
103
-
104
-
105
-
106
-
107
-
108
-
109
-
110
-
111
-
112
-
113
-
114
-
115
-
116
-
117
-
118
-
119
-
120
-
121
-
122
-
123
-
124
-
125
-
126
-
127
 |
 |

UNITED PARCEL SERVICE, INC. AND SUBSIDIARIES
NOTES TO CONSOLIDATED FINANCIAL STATEMENTS
65
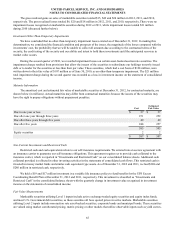
The gross realized gains on sales of marketable securities totaled $15, $49 and $24 million in 2012, 2011, and 2010,
respectively. The gross realized losses totaled $6, $20 and $18 million in 2012, 2011, and 2010, respectively. There were no
impairment losses recognized on marketable securities during 2012 or 2011, while impairment losses totaled $21 million
during 2010 (discussed further below).
Investment Other-Than-Temporary Impairments
We have concluded that no other-than-temporary impairment losses existed as of December 31, 2012. In making this
determination, we considered the financial condition and prospects of the issuer, the magnitude of the losses compared with the
investments’ cost, the probability that we will be unable to collect all amounts due according to the contractual terms of the
security, the credit rating of the security and our ability and intent to hold these investments until the anticipated recovery in
market value occurs.
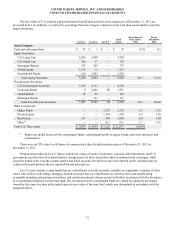
During the second quarter of 2010, we recorded impairment losses on certain asset-backed auction rate securities. The
impairment charge resulted from provisions that allow the issuers of the securities to subordinate our holdings to newly issued
debt or to tender for the securities at less than their par value. These securities, which had a cost basis of $128 million, were
written down to their fair value of $107 million as of June 30, 2010, as an other-than-temporary impairment. The $21 million
total impairment charge during the second quarter was recorded as a loss in investment income on the statement of consolidated
income.
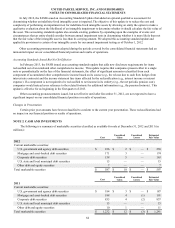
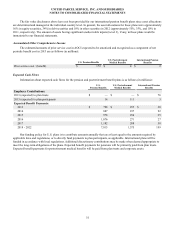
Maturity Information
The amortized cost and estimated fair value of marketable securities at December 31, 2012, by contractual maturity, are
shown below (in millions). Actual maturities may differ from contractual maturities because the issuers of the securities may
have the right to prepay obligations without prepayment penalties.
Cost
Estimated
Fair Value
Due in one year or less $ 37 $ 37
Due after one year through three years 251 252
Due after three years through five years 49 49
Due after five years 248 257
585 595
Equity securities 2 2
$ 587 $ 597
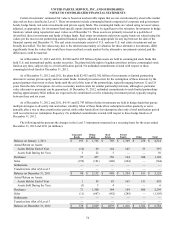
Non-Current Investments and Restricted Cash
Restricted cash and cash equivalents relate to our self-insurance requirements. We entered into an escrow agreement with
an insurance carrier to guarantee our self-insurance obligations. This agreement requires us to provide cash collateral to the
insurance carrier, which is reported in “Investments and Restricted Cash” on our consolidated balance sheets. Additional cash
collateral provided is reflected in other investing activities in the statements of consolidated cash flows. This restricted cash is
invested in money market funds and similar cash equivalent type assets. As of December 31, 2012 and 2011, we had $288 and
$286 million in restricted cash, respectively.
We held a $19 and $17 million investment in a variable life insurance policy to fund benefits for the UPS Excess
Coordinating Benefit Plan at December 31, 2012 and 2011, respectively. This investment is classified as “Investments and
Restricted Cash” in the consolidated balance sheets with the quarterly change in investment value recognized in investment
income on the statements of consolidated income.
Fair Value Measurements
Marketable securities utilizing Level 1 inputs include active exchange-traded equity securities and equity index funds,
and most U.S. Government debt securities, as these securities all have quoted prices in active markets. Marketable securities
utilizing Level 2 inputs include non-auction rate asset-backed securities, corporate bonds and municipal bonds. These securities
are valued using market corroborated pricing, matrix pricing or other models that utilize observable inputs such as yield curves.