UPS 2012 Annual Report Download - page 5
Download and view the complete annual report
Please find page 5 of the 2012 UPS annual report below. You can navigate through the pages in the report by either clicking on the pages listed below, or by using the keyword search tool below to find specific information within the annual report.-
 1
1 -
 2
2 -
 3
3 -
 4
4 -
 5
5 -
 6
6 -
 7
7 -
 8
8 -
 9
9 -
 10
10 -
 11
11 -
 12
12 -
 13
13 -
 14
14 -
 15
15 -
 16
16 -
17
-
18
-
19
-
20
-
21
-
22
-
23
-
24
-
25
-
26
-
27
-
28
-
29
-
30
-
31
-
32
-
33
-
34
-
35
-
36
-
37
-
38
-
39
-
40
-
41
-
42
-
43
-
44
-
45
-
46
-
47
-
48
-
49
-
50
-
51
-
52
-
53
-
54
-
55
-
56
-
57
-
58
-
59
-
60
-
61
-
62
-
63
-
64
-
65
-
66
-
67
-
68
-
69
-
70
-
71
-
72
-
73
-
74
-
75
-
76
-
77
-
78
-
79
-
80
-
81
-
82
-
83
-
84
-
85
-
86
-
87
-
88
-
89
-
90
-
91
-
92
-
93
-
94
-
95
-
96
-
97
-
98
-
99
-
100
-
101
-
102
-
103
-
104
-
105
-
106
-
107
-
108
-
109
-
110
-
111
-
112
-
113
-
114
-
115
-
116
-
117
-
118
-
119
-
120
-
121
-
122
-
123
-
124
-
125
-
126
-
127
 |
 |

UPS 2012 ANNUAL REPORT
03
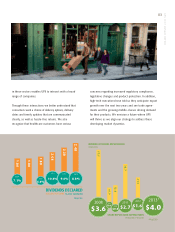
in these sectors enables UPS to interact with a broad
range of companies.
Through these interactions we better understand that
consumers want a choice of delivery options, delivery
dates and timely updates that are communicated
clearly, as well as hassle-free returns. We also
recognize that healthcare customers have serious
concerns regarding increased regulatory compliance,
legislative changes and product protection. In addition,
high-tech executives have told us they anticipate export
growth over the next two years and see trade agree-
ments and the growing middle-classes driving demand
for their products. We envision a future where UPS
will thrive as we align our strategy to address these
developing market dynamics.
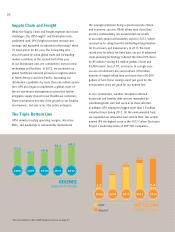
38.7
12.4
10.9
53.6
21.8
2008
$3.6
2009
$0.6 2010
$0.8
2011
$2.7
IN BILLIONS OF DOLLARS
SHARE REPURCHASE EXPENDITURES
2012
$1.6
IN MILLIONS
NUMBER OF SHARES REPURCHASED
2013*
$4.0
*PROJECTED
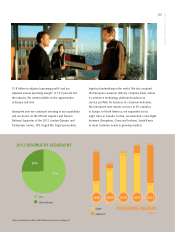
DOLLARS PER SHARE % YOY GROWTH
DIVIDENDS DECLARED
2.28
2.08
1.88
1.80
1.80
2008
7.1% 2010
4.4%
10.6%
2011
9.6%
2012
2.48
8.8%
2013*
*PROJECTED