UPS 2012 Annual Report Download - page 42
Download and view the complete annual report
Please find page 42 of the 2012 UPS annual report below. You can navigate through the pages in the report by either clicking on the pages listed below, or by using the keyword search tool below to find specific information within the annual report.-
 1
1 -
2
-
3
-
4
-
5
-
6
-
7
-
8
-
9
-
10
-
11
-
12
-
13
-
14
-
15
-
16
-
17
-
18
-
19
-
20
-
21
-
22
-
23
-
24
-
25
-
26
-
27
-
28
-
29
-
30
-
31
-
 32
32 -
 33
33 -
 34
34 -
 35
35 -
 36
36 -
 37
37 -
 38
38 -
 39
39 -
 40
40 -
 41
41 -
 42
42 -
 43
43 -
 44
44 -
 45
45 -
 46
46 -
 47
47 -
 48
48 -
 49
49 -
 50
50 -
 51
51 -
 52
52 -
53
-
54
-
55
-
56
-
57
-
58
-
59
-
60
-
61
-
62
-
63
-
64
-
65
-
66
-
67
-
68
-
69
-
70
-
71
-
72
-
73
-
74
-
75
-
76
-
77
-
78
-
79
-
80
-
81
-
82
-
83
-
84
-
85
-
86
-
87
-
88
-
89
-
90
-
91
-
92
-
93
-
94
-
95
-
96
-
97
-
98
-
99
-
100
-
101
-
102
-
103
-
104
-
105
-
106
-
107
-
108
-
109
-
110
-
111
-
112
-
113
-
114
-
115
-
116
-
117
-
118
-
119
-
120
-
121
-
122
-
123
-
124
-
125
-
126
-
127
 |
 |
UNITED PARCEL SERVICE, INC. AND SUBSIDIARIES
MANAGEMENT'S DISCUSSION AND ANALYSIS OF FINANCIAL CONDITION AND
RESULTS OF OPERATIONS
30
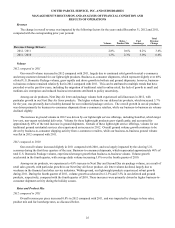
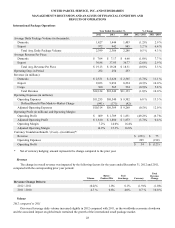
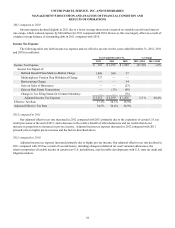
On January 3, 2011, we increased the base rates 6.9% for international shipments originating in the United States
(Worldwide Express, Worldwide Express Plus, UPS Worldwide Expedited and UPS International Standard service), while
reducing the fuel surcharge indices. Rate changes for shipments originating outside the U.S. are made throughout the year and
vary by geographic market.
Fuel Surcharges
In connection with our base rate increases on January 2, 2012 and January 3, 2011, we modified the fuel surcharges on
certain U.S.-related international air services by reducing the index used to determine the fuel surcharge by 2% in each of the
two years. The fuel surcharges for air products originating outside the United States are indexed to the DOE's Gulf Coast spot
price for a gallon of kerosene-type jet fuel, while the fuel surcharges for ground products originating outside the United States
are indexed to fuel prices in the international region or country where the shipment takes place. Total international fuel
surcharge revenue increased by $11 and $449 million in 2012 and 2011, respectively, due to higher fuel surcharge rates caused
by increased fuel prices as well as an increase in international air volume.
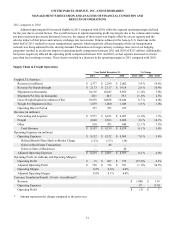
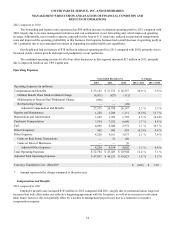
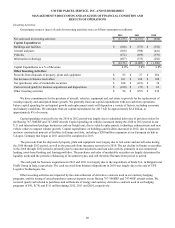
Operating Expenses
2012 compared to 2011
Overall adjusted operating expenses for the segment decreased $55 million in 2012 compared with 2011. The largest
component of this decrease related to the cost of operating our international integrated air and ground network, which
decreased $117 million. This decrease primarily resulted from cost control initiatives, including a 1.8% reduction in average
daily aircraft block hours resulting from ongoing modifications to our air network. The cost of pick-up and delivery decreased
$53 million, largely due to the impact of currency exchange rate movements and in-country cost control initiatives.
Partially offsetting these cost reductions was an increase in indirect operating costs, which increased $143 million in
2012 compared with 2011. This increase was impacted by our investment in enhanced security screening for our international
locations and expenses associated with business acquisition activities, including our proposed acquisition of TNT Express N.V.
(see note 16 to the consolidated financial statements) as well as the February 2012 acquisition of Kiala S.A.
Excluding the impact of currency exchange rate changes, the total cost per piece for the segment increased 2.3% in 2012
compared with 2011.
2011 compared to 2010
Overall adjusted operating expenses for the segment increased $1.109 billion in 2011 compared with 2010. The impact of
foreign currency exchange rate changes resulted in an adverse impact on operating expense comparisons between 2011 and
2010 of $198 million. Excluding the impact of currency exchange rate changes, the total adjusted cost per piece for the segment
increased 4.7% for the year.
The increase in adjusted operating expenses, excluding the impact of currency, was largely due to the increased cost of
operating our international integrated air and ground network, and also higher pick-up and delivery costs. Network costs
increased $745 million for the year, largely due to higher fuel costs and increased block hours, as well as an increase in aircraft
repair and maintenance expenses. Pick-up and delivery costs increased $123 million for the year, primarily as a result of higher
fuel prices and increased package volume.
Operating Profit and Margin
2012 compared to 2011
Adjusted operating margin declined 40 basis points in 2012 compared with 2011, as the product mix shift from our
premium express products to our standard products in 2012 reduced margins in this segment. Additionally, the volume declines
in certain key transcontinental trade lanes during portions of 2012 also adversely impacted margins, since these routes have a
larger cost infrastructure (relative to the remainder of the International Package segment) to support the air express volume in
each region. These factors were mitigated, however, from benefits derived from air network adjustments, cost containment
programs and the positive impact from foreign currency exchange rate fluctuations. As a result, we experienced a 3.7% decline
in adjusted operating profit in 2012 compared with 2011.