UPS 2012 Annual Report Download - page 2
Download and view the complete annual report
Please find page 2 of the 2012 UPS annual report below. You can navigate through the pages in the report by either clicking on the pages listed below, or by using the keyword search tool below to find specific information within the annual report.-
 1
1 -
 2
2 -
 3
3 -
 4
4 -
 5
5 -
 6
6 -
 7
7 -
 8
8 -
 9
9 -
 10
10 -
 11
11 -
 12
12 -
 13
13 -
14
-
15
-
16
-
17
-
18
-
19
-
20
-
21
-
22
-
23
-
24
-
25
-
26
-
27
-
28
-
29
-
30
-
31
-
32
-
33
-
34
-
35
-
36
-
37
-
38
-
39
-
40
-
41
-
42
-
43
-
44
-
45
-
46
-
47
-
48
-
49
-
50
-
51
-
52
-
53
-
54
-
55
-
56
-
57
-
58
-
59
-
60
-
61
-
62
-
63
-
64
-
65
-
66
-
67
-
68
-
69
-
70
-
71
-
72
-
73
-
74
-
75
-
76
-
77
-
78
-
79
-
80
-
81
-
82
-
83
-
84
-
85
-
86
-
87
-
88
-
89
-
90
-
91
-
92
-
93
-
94
-
95
-
96
-
97
-
98
-
99
-
100
-
101
-
102
-
103
-
104
-
105
-
106
-
107
-
108
-
109
-
110
-
111
-
112
-
113
-
114
-
115
-
116
-
117
-
118
-
119
-
120
-
121
-
122
-
123
-
124
-
125
-
126
-
127
 |
 |

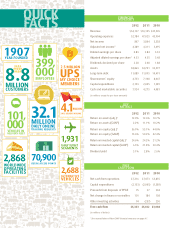
FINANCIAL
HIGHLIGHTS
FINANCIALFINANCIAL
KEY
METRICS
KEY
KEY
FREE
CASH FLOW
FREE
FREE
2012 2011 2010
Revenue $54,127 $53,105 $49,545
Operating expenses 52,784 47,025 43,904
Net income 807 3,804 3,338
Adjusted net income1 4,389 4,311 3,495
Diluted earnings per share 0.83 3.84 3.33
Adjusted diluted earnings per share1 4.53 4.35 3.48
Dividends declared per share 2.28 2.08 1.88
Assets 38,863 34,701 33,597
Long-term debt 11,089 11,095 10,491
Shareowners’ equity 4,733 7,108 8,047
Capital expenditures 2,153 2,005 1,389
Cash and marketable securities 7,924 4,275 4,081
2012 2011 2010
Return on assets (adj.)1 12.0% 12.6% 10.7%
Return on assets (GAAP) 2.2% 11.1% 10.2%
Return on equity (adj.)1 56.9% 55.1% 44.0%
Return on equity (GAAP) 13.6% 50.2% 42.4%
Return on invested capital (adj.)1 24.6% 24.2% 21.2%
Return on invested capital (GAAP) 6.5% 21.8% 20.4%
Dividend yield 3.1% 2.8% 2.6%
(in millions except for per-share amounts)
(in millions of dollars)
2012 2011 2010
Net cash from operations $7,216 $7,073 $3,835
Capital expenditures (2,153) (2,005) (1,389)
Proceeds from disposals of PP&E 95 27 304
Net change in finance receivables 101 184 108
Other investing activities 94 (257) 230
Free cash flow $5,353 $5,022 $3,088
1 See reconciliation of Non-GAAP financial measures on page A1.
YEAR FOUNDED
1907
EMPLOYEES
399,
000
MILLION
CUSTOMERS
8.8
MILLION
DAILY ONLINE
TRACKING REQUESTS
32.1
MEMBERS
UPS
MY CHOICE®
2.5 MILLION
VEHICLES IN
DELIVERY FLEET
101,
000
QU
K
UI
Q
QUICK
FACTS
CT
S
S
FA
AC
A
FACTS
QUICK
QUICK
WORLDWIDE
OPERATING
FACILITIES
2,868 RETAIL ACCESS POINTS
70,900
4.1
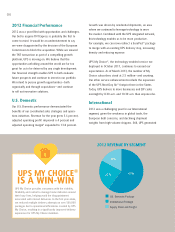
2012 DELIVERY VOLUME
BILLION
DAILY FLIGHT
SEGMENTS
1,931
2,688
ALTERNATIVE
VEHICLES