Redbox 2013 Annual Report Download - page 99
Download and view the complete annual report
Please find page 99 of the 2013 Redbox annual report below. You can navigate through the pages in the report by either clicking on the pages listed below, or by using the keyword search tool below to find specific information within the annual report.-
 1
1 -
2
-
3
-
4
-
5
-
6
-
7
-
8
-
9
-
10
-
11
-
12
-
13
-
14
-
15
-
16
-
17
-
18
-
19
-
20
-
21
-
22
-
23
-
24
-
25
-
26
-
27
-
28
-
29
-
30
-
31
-
32
-
33
-
34
-
35
-
36
-
37
-
38
-
39
-
40
-
41
-
42
-
43
-
44
-
45
-
46
-
47
-
48
-
49
-
50
-
51
-
52
-
53
-
54
-
55
-
56
-
57
-
58
-
59
-
60
-
61
-
62
-
63
-
64
-
65
-
66
-
67
-
68
-
69
-
70
-
71
-
72
-
73
-
74
-
75
-
76
-
77
-
78
-
79
-
80
-
81
-
82
-
83
-
84
-
85
-
86
-
87
-
88
-
 89
89 -
 90
90 -
 91
91 -
 92
92 -
 93
93 -
 94
94 -
 95
95 -
 96
96 -
 97
97 -
 98
98 -
 99
99 -
 100
100 -
 101
101 -
 102
102 -
 103
103 -
 104
104 -
 105
105 -
 106
106 -
 107
107 -
 108
108 -
 109
109 -
110
-
111
-
112
-
113
-
114
-
115
-
116
-
117
-
118
-
119
 |
 |

90
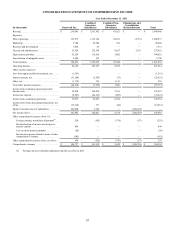
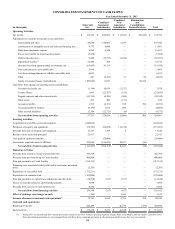
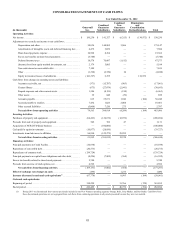
CONSOLIDATING BALANCE SHEETS
As of December 31, 2012
(in thousands) Outerwall Inc.
Combined
Guarantor
Subsidiaries
Combined Non-
Guarantor
Subsidiaries
Eliminations
and
Consolidation
Reclassifications Total
Assets
Current Assets:
Cash and cash equivalents . . . . . . . . . . . . . . . . . . $ 242,489 $ — $ 40,759 $ (354) $ 282,894
Accounts receivable, net of allowances . . . . . . . . 887 56,293 1,151 — 58,331
Content library . . . . . . . . . . . . . . . . . . . . . . . . . . . 1,130 173,339 2,940 — 177,409
Deferred income taxes . . . . . . . . . . . . . . . . . . . . . 27,372 — 899 (21,084) 7,187
Prepaid expenses and other current assets . . . . . . 11,748 17,504 434 — 29,686
Intercompany receivables. . . . . . . . . . . . . . . . . . . 119,848 76,878 3,581 (200,307) —
Total current assets . . . . . . . . . . . . . . . . . . . 403,474 324,014 49,764 (221,745) 555,507
Property and equipment, net . . . . . . . . . . . . . . . . . . . . . 188,251 368,620 29,253 — 586,124
Notes receivable . . . . . . . . . . . . . . . . . . . . . . . . . . . . . . 26,731———26,731
Deferred income taxes. . . . . . . . . . . . . . . . . . . . . . . . . . — — 1,334 39 1,373
Goodwill and other intangible assets. . . . . . . . . . . . . . . 253,395 90,614 — 54 344,063
Other long-term assets. . . . . . . . . . . . . . . . . . . . . . . . . . 18,992 28,906 29 — 47,927
Investment in related parties . . . . . . . . . . . . . . . . . . . . . 90,828 24,395 — (115,223) —
Total assets. . . . . . . . . . . . . . . . . . . . . . . . . . . . . . . . . . . $ 981,671 $ 836,549 $ 80,380 $ (336,875) $ 1,561,725
Liabilities and Stockholders’ Equity
Current Liabilities:
Accounts payable . . . . . . . . . . . . . . . . . . . . . . . . . $ 21,368 $ 225,463 $ 4,111 $ (354) $ 250,588
Accrued payable to retailers . . . . . . . . . . . . . . . . . 77,266 46,493 14,654 — 138,413
Other accrued liabilities . . . . . . . . . . . . . . . . . . . . 50,314 92,724 3,087 — 146,125
Current portion of long-term debt and other . . . . 15,312 217 — — 15,529
Current portion of capital lease obligations . . . . . 13,002 — 348 — 13,350
Deferred income taxes . . . . . . . . . . . . . . . . . . . . . — 21,084 — (21,084) —
Intercompany payables. . . . . . . . . . . . . . . . . . . . . 56,473 108,347 35,487 (200,307) —
Total current liabilities. . . . . . . . . . . . . . . . . 233,735 494,328 57,687 (221,745) 564,005
Long-term debt and other long-term liabilities . . . . . . . 322,279 18,724 176 — 341,179
Capital lease obligations . . . . . . . . . . . . . . . . . . . . . . . . 15,180 — 522 — 15,702
Deferred income taxes. . . . . . . . . . . . . . . . . . . . . . . . . . 54,855 36,857 — 39 91,751
Total liabilities. . . . . . . . . . . . . . . . . . . . . . . . . . . . . . . . 626,049 549,909 58,385 (221,706) 1,012,637
Commitments and contingencies
Stockholders’ Equity:
Preferred stock . . . . . . . . . . . . . . . . . . . . . . . . . . . —————
Common stock . . . . . . . . . . . . . . . . . . . . . . . . . . . 574,842 145,425 12,444 (227,830) 504,881
Treasury stock . . . . . . . . . . . . . . . . . . . . . . . . . . . (293,149) — — — (293,149)
Retained earnings . . . . . . . . . . . . . . . . . . . . . . . . . 74,985 141,215 10,118 112,661 338,979
Accumulated other comprehensive loss . . . . . . . . (1,056) — (567) — (1,623)
Total stockholders’ equity . . . . . . . . . . . . . . 355,622 286,640 21,995 (115,169) 549,088
Total liabilities and stockholders’ equity. . . . . . . . . . . . $ 981,671 $ 836,549 $ 80,380 $ (336,875) $ 1,561,725