Redbox 2013 Annual Report Download - page 40
Download and view the complete annual report
Please find page 40 of the 2013 Redbox annual report below. You can navigate through the pages in the report by either clicking on the pages listed below, or by using the keyword search tool below to find specific information within the annual report.-
 1
1 -
2
-
3
-
4
-
5
-
6
-
7
-
8
-
9
-
10
-
11
-
12
-
13
-
14
-
15
-
16
-
17
-
18
-
19
-
20
-
21
-
22
-
23
-
24
-
25
-
26
-
27
-
28
-
29
-
 30
30 -
 31
31 -
 32
32 -
 33
33 -
 34
34 -
 35
35 -
 36
36 -
 37
37 -
 38
38 -
 39
39 -
 40
40 -
 41
41 -
 42
42 -
 43
43 -
 44
44 -
 45
45 -
 46
46 -
 47
47 -
 48
48 -
 49
49 -
 50
50 -
51
-
52
-
53
-
54
-
55
-
56
-
57
-
58
-
59
-
60
-
61
-
62
-
63
-
64
-
65
-
66
-
67
-
68
-
69
-
70
-
71
-
72
-
73
-
74
-
75
-
76
-
77
-
78
-
79
-
80
-
81
-
82
-
83
-
84
-
85
-
86
-
87
-
88
-
89
-
90
-
91
-
92
-
93
-
94
-
95
-
96
-
97
-
98
-
99
-
100
-
101
-
102
-
103
-
104
-
105
-
106
-
107
-
108
-
109
-
110
-
111
-
112
-
113
-
114
-
115
-
116
-
117
-
118
-
119
 |
 |

31
implementation and maintenance of our Enterprise Resource Planning system offset in the comparative 2011 period by
an international tax assessment expense which did not recur in 2012; partially offset by
• $8.4 million increase in revenue as described above;
• $2.1 million decrease in research and development expenses primarily due to higher capitalization of certain expenses
in 2012 related to the development of internal use software; and
• $1.2 million decrease in marketing expenses due to lower advertising spend.
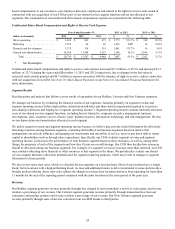
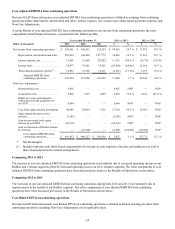
New Ventures
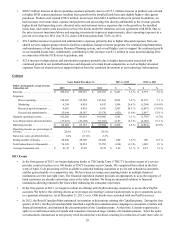
Years Ended December 31, 2013 vs. 2012 2012 vs. 2011
Dollars in thousands 2013 2012 2011 $ % $ %
Revenue. . . . . . . . . . . . . . . . . . . . . . . . . $ 31,852 $ 350 $ 66 $ 31,502 NM* $ 284 430.3%
Expenses:
Direct operating. . . . . . . . . . . . . . . 29,433 1,317 235 28,116 NM* 1,082 460.4%
Marketing . . . . . . . . . . . . . . . . . . . 1,589 478 217 1,111 232.4% 261 120.3%
Research and development . . . . . . 4,669 1,229 617 3,440 279.9% 612 99.2%
General and administrative . . . . . . 15,551 6,283 4,529 9,268 147.5% 1,754 38.7%
Segment operating loss . . . . . . . . . . . . . (19,390) (8,957) (5,532) (10,433) 116.5% (3,425) 61.9%
Less: depreciation and amortization . . . (6,536) (229) (20) (6,307) NM* (209) NM*
Operating loss . . . . . . . . . . . . . . . . . . . . $ (25,926) $ (9,186) $ (5,552) $ (16,740) 182.2% $ (3,634) 65.5%
Ending number of kiosks . . . . . . . . . . . 900 50 —850 NM* 50 NM*
* Not Meaningful
2013 Events
• On July 23, 2013 we completed our acquisition of ecoATM (See Note 3: Business Combinations in our Notes to
Consolidated Financial Statements). The impact of this acquisition on our New Ventures segment operating results is
discussed below.
• During 2013, we discontinued four New Venture concepts, Orango, Rubi, Crisp Market and Star Studio. The results of
our discontinued concepts and associated impairment and restructuring charges were recorded within loss from
discontinued operations, net of tax on our Consolidated Statements of Comprehensive Income. See Note 13:
Discontinued Operations and Sale of Business and Note 11: Restructuring in our Notes to Consolidated Financial
Statements for further information.
Comparing 2013 to 2012
Revenue increased $31.5 million primarily due to the acquisition of ecoATM.
Operating loss increased $16.7 million, or 182.2%, primarily due to the following:
• $28.1 million increase in direct operating expenses primarily due to results in 2013 including ecoATM since its
acquisition and shared services costs associated with adding kiosks to the marketplace;
• $9.3 million increase in general and administrative expenses primarily due to $5.7 million in transaction expenses
related to the acquisition of ecoATM, general and administrative expenses for ecoATM in 2013 since its acquisition,
and shared services costs to support concept growth;
• $6.3 million increase in depreciation and amortization primarily due to results in 2013 including ecoATM since its
acquisition and additional depreciation on equipment to support growth;
• $3.4 million increase in research and development due to results in 2013 including ecoATM since its acquisition and
spending to support existing concepts;
• $1.1 million increase in marketing expense primarily due to results in 2013 including ecoATM since its acquisition
and spending initiatives to support growth of existing concepts; partially offset by
• $31.5 million increase in revenue as described above.