Redbox 2013 Annual Report Download - page 98
Download and view the complete annual report
Please find page 98 of the 2013 Redbox annual report below. You can navigate through the pages in the report by either clicking on the pages listed below, or by using the keyword search tool below to find specific information within the annual report.-
 1
1 -
2
-
3
-
4
-
5
-
6
-
7
-
8
-
9
-
10
-
11
-
12
-
13
-
14
-
15
-
16
-
17
-
18
-
19
-
20
-
21
-
22
-
23
-
24
-
25
-
26
-
27
-
28
-
29
-
30
-
31
-
32
-
33
-
34
-
35
-
36
-
37
-
38
-
39
-
40
-
41
-
42
-
43
-
44
-
45
-
46
-
47
-
48
-
49
-
50
-
51
-
52
-
53
-
54
-
55
-
56
-
57
-
58
-
59
-
60
-
61
-
62
-
63
-
64
-
65
-
66
-
67
-
68
-
69
-
70
-
71
-
72
-
73
-
74
-
75
-
76
-
77
-
78
-
79
-
80
-
81
-
82
-
83
-
84
-
85
-
86
-
87
-
 88
88 -
 89
89 -
 90
90 -
 91
91 -
 92
92 -
 93
93 -
 94
94 -
 95
95 -
 96
96 -
 97
97 -
 98
98 -
 99
99 -
 100
100 -
 101
101 -
 102
102 -
 103
103 -
 104
104 -
 105
105 -
 106
106 -
 107
107 -
 108
108 -
109
-
110
-
111
-
112
-
113
-
114
-
115
-
116
-
117
-
118
-
119
 |
 |
89
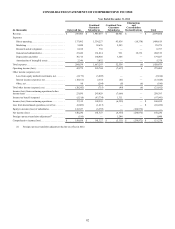
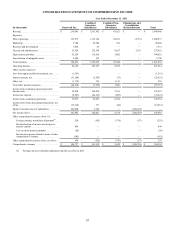
CONSOLIDATING BALANCE SHEETS
As of December 31, 2013
(in thousands) Outerwall Inc.
Combined
Guarantor
Subsidiaries
Combined Non-
Guarantor
Subsidiaries
Eliminations
and
Consolidation
Reclassifications Total
Assets
Current Assets:
Cash and cash equivalents . . . . . . . . . . . . . . . . . . $ 315,250 $ 9,639 $ 46,548 $ — $ 371,437
Accounts receivable, net of allowances . . . . . . . . 2,029 45,672 2,595 — 50,296
Content library . . . . . . . . . . . . . . . . . . . . . . . . . . . 37 196,695 3,136 — 199,868
Deferred income taxes . . . . . . . . . . . . . . . . . . . . . 12,152 — 8 (12,149) 11
Prepaid expenses and other current assets . . . . . . 55,512 28,234 952 — 84,698
Intercompany receivables. . . . . . . . . . . . . . . . . . . 180,100 355,418 5,093 (540,611) —
Total current assets . . . . . . . . . . . . . . . . . . . 565,080 635,658 58,332 (552,760) 706,310
Property and equipment, net . . . . . . . . . . . . . . . . . . . . . 163,747 320,296 36,822 — 520,865
Deferred income taxes. . . . . . . . . . . . . . . . . . . . . . . . . . — — 6,412 31 6,443
Goodwill and other intangible assets. . . . . . . . . . . . . . . 251,150 387,540 — — 638,690
Other long-term assets. . . . . . . . . . . . . . . . . . . . . . . . . . 12,473 11,499 420 — 24,392
Investment in related parties . . . . . . . . . . . . . . . . . . . . . 815,243 4,825 — (820,068) —
Total assets. . . . . . . . . . . . . . . . . . . . . . . . . . . . . . . . . . . $ 1,807,693 $ 1,359,818 $ 101,986 $ (1,372,797) $ 1,896,700
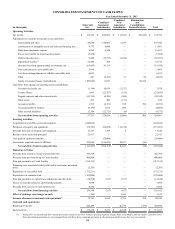
Liabilities and Stockholders’ Equity
Current Liabilities:
Accounts payable . . . . . . . . . . . . . . . . . . . . . . . . . $ 17,336 $ 215,703 $ 2,979 $ — $ 236,018
Accrued payable to retailers . . . . . . . . . . . . . . . . . 71,085 48,126 14,929 — 134,140
Other accrued liabilities . . . . . . . . . . . . . . . . . . . . 59,444 71,607 3,076 — 134,127
Current callable convertible debt . . . . . . . . . . . . . 49,702———49,702
Current portion of long-term debt and other . . . . 42,187 3 — — 42,190
Current portion of capital lease obligations . . . . . 11,630 — 367 — 11,997
Deferred income taxes . . . . . . . . . . . . . . . . . . . . . — 35,292 — (12,149) 23,143
Intercompany payables. . . . . . . . . . . . . . . . . . . . . 315,615 154,565 70,432 (540,612) —
Total current liabilities. . . . . . . . . . . . . . . . . 566,999 525,296 91,783 (552,761) 631,317
Long-term debt and other long-term liabilities . . . . . . . 658,032 18,748 576 — 677,356
Capital lease obligations . . . . . . . . . . . . . . . . . . . . . . . . 8,912 — 452 — 9,364
Deferred income taxes. . . . . . . . . . . . . . . . . . . . . . . . . . 45,307 13,190 — 31 58,528
Total liabilities. . . . . . . . . . . . . . . . . . . . . . . . . . . . . . . . 1,279,250 557,234 92,811 (552,730) 1,376,565
Commitments and contingencies
Debt conversion feature. . . . . . . . . . . . . . . . . . . . . . . . . 1,446———1,446
Stockholders’ Equity:
Preferred stock . . . . . . . . . . . . . . . . . . . . . . . . . . . —————
Common stock . . . . . . . . . . . . . . . . . . . . . . . . . . . 596,995 225,016 12,393 (351,923) 482,481
Treasury stock . . . . . . . . . . . . . . . . . . . . . . . . . . . (476,796) — — — (476,796)
Retained earnings . . . . . . . . . . . . . . . . . . . . . . . . . 407,959 577,568 (3,612) (468,144) 513,771
Accumulated other comprehensive loss . . . . . . . . (1,161) — 394 — (767)
Total stockholders’ equity . . . . . . . . . . . . . . 526,997 802,584 9,175 (820,067) 518,689
Total liabilities and stockholders’ equity. . . . . . . . . . . . $ 1,807,693 $ 1,359,818 $ 101,986 $ (1,372,797) $ 1,896,700