Redbox 2013 Annual Report Download - page 27
Download and view the complete annual report
Please find page 27 of the 2013 Redbox annual report below. You can navigate through the pages in the report by either clicking on the pages listed below, or by using the keyword search tool below to find specific information within the annual report.-
 1
1 -
2
-
3
-
4
-
5
-
6
-
7
-
8
-
9
-
10
-
11
-
12
-
13
-
14
-
15
-
16
-
 17
17 -
 18
18 -
 19
19 -
 20
20 -
 21
21 -
 22
22 -
 23
23 -
 24
24 -
 25
25 -
 26
26 -
 27
27 -
 28
28 -
 29
29 -
 30
30 -
 31
31 -
 32
32 -
 33
33 -
 34
34 -
 35
35 -
 36
36 -
 37
37 -
38
-
39
-
40
-
41
-
42
-
43
-
44
-
45
-
46
-
47
-
48
-
49
-
50
-
51
-
52
-
53
-
54
-
55
-
56
-
57
-
58
-
59
-
60
-
61
-
62
-
63
-
64
-
65
-
66
-
67
-
68
-
69
-
70
-
71
-
72
-
73
-
74
-
75
-
76
-
77
-
78
-
79
-
80
-
81
-
82
-
83
-
84
-
85
-
86
-
87
-
88
-
89
-
90
-
91
-
92
-
93
-
94
-
95
-
96
-
97
-
98
-
99
-
100
-
101
-
102
-
103
-
104
-
105
-
106
-
107
-
108
-
109
-
110
-
111
-
112
-
113
-
114
-
115
-
116
-
117
-
118
-
119
 |
 |

18
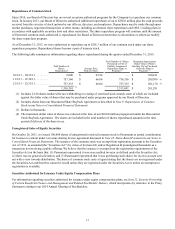
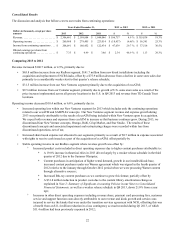
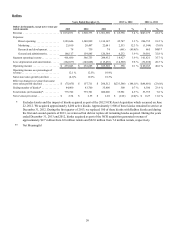
ITEM 6. SELECTED FINANCIAL DATA
The selected consolidated financial data below should be read in conjunction with Management’s Discussion and Analysis of
Financial Condition and Results of Operations and the consolidated financial statements and notes thereto included elsewhere
in this Form 10-K.
(In thousands, except per share data) Years Ended December 31,
Statement of Comprehensive Income Data 2013 2012 2011 2010 2009
Revenue . . . . . . . . . . . . . . . . . . . . . . . . . . . . . . . . $ 2,306,601 $ 2,199,884 $ 1,844,046 $ 1,435,721 $ 1,032,028
Operating income. . . . . . . . . . . . . . . . . . . . . . . . . $ 260,968 $ 279,405 $ 223,014 $ 153,064 $ 106,963
Income from continuing operations . . . . . . . . . . . $ 208,091 $ 160,452 $ 122,934 $ 71,964 $ 45,066
Loss from discontinued operations, net of tax(1) .(33,299) (10,222)(19,051)(20,956)(4,909)
Net income . . . . . . . . . . . . . . . . . . . . . . . . . . . . . . 174,792 150,230 103,883 51,008 40,157
Net income (loss) attributable to non-controlling
interests(2) . . . . . . . . . . . . . . . . . . . . . . . . . . . . . . . ————
(3,627)
Net income attributable to Outerwall Inc. . . . . . . $ 174,792 $ 150,230 $ 103,883 $ 51,008 $ 36,530
Basic earnings per share from continuing
operations attributable to Outerwall Inc. . . . . . . . $ 7.65 $ 5.30 $ 4.02 $ 2.30 $ 1.37
Basic loss per share from discontinued
operations attributable to Outerwall Inc. . . . . . . . (1.23) (0.34)(0.62)(0.67)(0.16)
Basic earnings per share attributable to
Outerwall Inc.. . . . . . . . . . . . . . . . . . . . . . . . . . . . $ 6.42 $ 4.96 $ 3.40 $ 1.63 $ 1.21
Diluted earnings per share from continuing
operations attributable to Outerwall Inc. . . . . . . . $ 7.33 $ 4.99 $ 3.86 $ 2.22 $ 1.36
Diluted loss per share from discontinued
operations attributable to Outerwall Inc. . . . . . . . (1.17) (0.32)(0.60)(0.65)(0.16)
Diluted earnings per share attributable to
Outerwall Inc.. . . . . . . . . . . . . . . . . . . . . . . . . . . . $ 6.16 $ 4.67 $ 3.26 $ 1.57 $ 1.20
Shares used in basic per share calculations . . . . . 27,216 30,305 30,520 31,268 30,152
Shares used in diluted per share calculations. . . . 28,381 32,174 31,869 32,397 30,514
As of December 31,
Balance Sheet Data 2013 2012 2011 2010 2009
Cash and cash equivalents . . . . . . . . . . . . . . . . . . $ 371,437 $ 282,894 $ 341,855 $ 183,416 $ 145,857
Total assets. . . . . . . . . . . . . . . . . . . . . . . . . . . . . . 1,896,700 1,561,725 1,450,837 1,265,598 1,205,686
Total debt, capital lease obligations and other. . . 790,609 385,760 397,099 377,321 468,755
Common stock . . . . . . . . . . . . . . . . . . . . . . . . . . . 482,481 504,881 481,249 434,169 406,333
Total stockholders’ equity . . . . . . . . . . . . . . . . . . 518,689 549,088 513,902 426,009 395,278
(1) Discontinued operations for all periods presented includes the results of operations from:
our Money Transfer Business, which we met the criteria to classify as a discontinued operation in the second quarter
of 2010 and sold in June 2011;
our E-Payment Business, which was sold in the second quarter of 2010; and
our Entertainment Business, which was sold in the third quarter of 2009.
four ventures previously included in our New Ventures operating segment, Orango, Rubi, Crisp Market, and Star
Studio which were discontinued during 2013.
(2) As a result of our ownership interest increase in Redbox from 47.3% to 51.0% on January 18, 2008, we began
consolidating Redbox’s financial results at this time. In addition, we purchased the remaining 49.0% of Redbox’s
interest in February 2009. There was no non-controlling interest reported after February 2009.