Redbox 2013 Annual Report Download - page 41
Download and view the complete annual report
Please find page 41 of the 2013 Redbox annual report below. You can navigate through the pages in the report by either clicking on the pages listed below, or by using the keyword search tool below to find specific information within the annual report.-
 1
1 -
2
-
3
-
4
-
5
-
6
-
7
-
8
-
9
-
10
-
11
-
12
-
13
-
14
-
15
-
16
-
17
-
18
-
19
-
20
-
21
-
22
-
23
-
24
-
25
-
26
-
27
-
28
-
29
-
30
-
 31
31 -
 32
32 -
 33
33 -
 34
34 -
 35
35 -
 36
36 -
 37
37 -
 38
38 -
 39
39 -
 40
40 -
 41
41 -
 42
42 -
 43
43 -
 44
44 -
 45
45 -
 46
46 -
 47
47 -
 48
48 -
 49
49 -
 50
50 -
 51
51 -
52
-
53
-
54
-
55
-
56
-
57
-
58
-
59
-
60
-
61
-
62
-
63
-
64
-
65
-
66
-
67
-
68
-
69
-
70
-
71
-
72
-
73
-
74
-
75
-
76
-
77
-
78
-
79
-
80
-
81
-
82
-
83
-
84
-
85
-
86
-
87
-
88
-
89
-
90
-
91
-
92
-
93
-
94
-
95
-
96
-
97
-
98
-
99
-
100
-
101
-
102
-
103
-
104
-
105
-
106
-
107
-
108
-
109
-
110
-
111
-
112
-
113
-
114
-
115
-
116
-
117
-
118
-
119
 |
 |

32
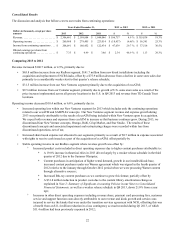
Comparing 2012 to 2011
Revenue increased $0.3 million, which was not significant.
Operating loss increased $3.6 million, or 65.5%, primarily due to the following:
• $1.8 million increase in general and administrative expense primarily due to increased shared services support costs to
support growth;
• $1.1 million increase in direct operating expenses primarily due to the addition of self-service concepts in test markets,
increased shared services support costs related primarily to deployment of new kiosks and customer service related
activity;
• $0.6 million increase in research and development expenses primarily due to kiosk design and prototype spending;
partially offset by
• $0.3 million increase in revenue as described above.
We expect to continue to invest in self-service concepts that meet our requirements and show the most promise towards future
success.
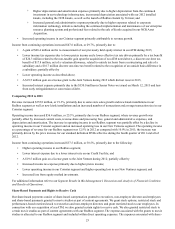
Income (Loss) from equity method investments
Comparing 2013 to 2012
Income from equity method investments increased to $19.9 million from a $5.2 million loss, primarily due to:
• $68.4 million gain on the re-measurement of our previously held equity interest in ecoATM during 2013; and
• $19.5 million gain on a license grant to the Joint Venture during 2012 which did not recur in 2013.
Excluding the one-time gain, in the near term, we expect continued losses from our equity method investments.
Comparing 2012 to 2011
Loss from equity method investments increased to $5.2 million in 2012 from $1.6 million in 2011 primarily due to our entry
into the Redbox Instant by Verizon joint venture in February 2012.
Additional financial information about our equity method investments is provided in Note 6: Equity Method Investments and
Related Party Transactions in our Notes to Consolidated Financial Statements.
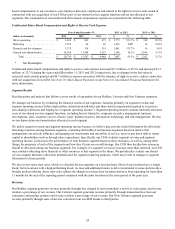
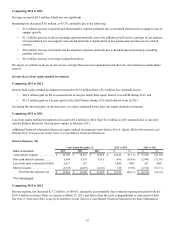
Interest Expense, Net
Years Ended December 31, 2013 vs 2012 2012 vs 2011
Dollars in thousands 2013 2012 2011 $ % $ %
Cash interest expense . . . . . . . . . . $ 25,289 $ 12,833 $ 16,468 $ 12,456 97.1 % $ (3,635) (22.1)%
Non-cash interest expense . . . . . . . 5,844 6,535 9,515 (691) (10.6)% (2,980) (31.3)%
Loss from early retirement of debt 6,013 953 — 5,060 NM* 953 NM*
Interest income . . . . . . . . . . . . . . . (4,345) (4,673) (2,161) 328 (7.0)% (2,512) 116.2 %
Total interest expense, net . . . $ 32,801 $ 15,648 $ 23,822 $ 17,153 109.6 % $ (8,174) (34.3)%
*Not Meaningful
Comparing 2013 to 2012
Interest expense, net increased $17.2 million, or 109.6%, during the year primarily due to interest expense associated with the
$350.0 million in Senior Notes we issued on March 12, 2013 and losses from the early extinguishment or conversion of debt.
See Note 8: Debt and Other Long-Term Liabilities in our Notes to Consolidated Financial Statements for more information.