Redbox 2013 Annual Report Download - page 35
Download and view the complete annual report
Please find page 35 of the 2013 Redbox annual report below. You can navigate through the pages in the report by either clicking on the pages listed below, or by using the keyword search tool below to find specific information within the annual report.-
 1
1 -
2
-
3
-
4
-
5
-
6
-
7
-
8
-
9
-
10
-
11
-
12
-
13
-
14
-
15
-
16
-
17
-
18
-
19
-
20
-
21
-
22
-
23
-
24
-
 25
25 -
 26
26 -
 27
27 -
 28
28 -
 29
29 -
 30
30 -
 31
31 -
 32
32 -
 33
33 -
 34
34 -
 35
35 -
 36
36 -
 37
37 -
 38
38 -
 39
39 -
 40
40 -
 41
41 -
 42
42 -
 43
43 -
 44
44 -
 45
45 -
46
-
47
-
48
-
49
-
50
-
51
-
52
-
53
-
54
-
55
-
56
-
57
-
58
-
59
-
60
-
61
-
62
-
63
-
64
-
65
-
66
-
67
-
68
-
69
-
70
-
71
-
72
-
73
-
74
-
75
-
76
-
77
-
78
-
79
-
80
-
81
-
82
-
83
-
84
-
85
-
86
-
87
-
88
-
89
-
90
-
91
-
92
-
93
-
94
-
95
-
96
-
97
-
98
-
99
-
100
-
101
-
102
-
103
-
104
-
105
-
106
-
107
-
108
-
109
-
110
-
111
-
112
-
113
-
114
-
115
-
116
-
117
-
118
-
119
 |
 |

26
Redbox
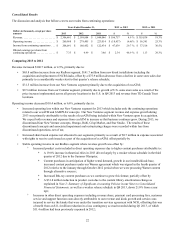
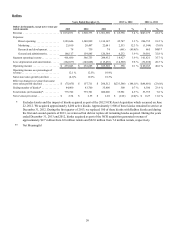
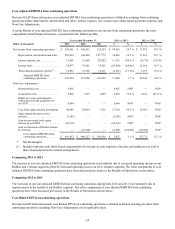
Years Ended December 31, 2013 vs. 2012 2012 vs. 2011
Dollars in thousands, except net revenue per
rental amounts 2013 2012 2011 $ % $ %
Revenue . . . . . . . . . . . . . . . . . . . . . . . . . . . $ 1,974,531 $ 1,908,773 $ 1,561,598 $ 65,758 3.4 % $347,175 22.2 %
Expenses:
Direct operating . . . . . . . . . . . . . . . . . 1,383,646 1,340,899 1,134,167 42,747 3.2 % 206,732 18.2 %
Marketing . . . . . . . . . . . . . . . . . . . . . . 23,010 20,497 22,041 2,513 12.3 % (1,544) (7.0)%
Research and development . . . . . . . . . 78 739 74 (661) (89.4)% 665 NM**
General and administrative . . . . . . . . . 166,117 159,885 120,384 6,232 3.9 % 39,501 32.8 %
Segment operating income . . . . . . . . . . . . . 401,680 386,753 284,932 14,927 3.9 % 101,821 35.7 %
Less: depreciation and amortization . . . . . . (162,637) (148,068) (115,430) (14,569) 9.8 % (32,638) 28.3 %
Operating income . . . . . . . . . . . . . . . . . . . . $ 239,043 $ 238,685 $ 169,502 $ 358 0.1 % $ 69,183 40.8 %
Operating income as a percentage of
revenue . . . . . . . . . . . . . . . . . . . . . . . . . . . . 12.1 % 12.5% 10.9%
Same store sales growth (decline) . . . . . . . (4.1)% 10.2% 18.3%
Effect on change in revenue from same
store sales growth (decline) . . . . . . . . . . . . $ (75,855) $ 157,711 $ 206,512 $(233,566) (148.1)% $(48,801) (23.6)%
Ending number of kiosks* . . . . . . . . . . . . . 44,000 43,700 35,400 300 0.7 % 8,300 23.4 %
Total rentals (in thousands)*. . . . . . . . . . . . 775,742 739,761 686,006 35,981 4.9 % 53,755 7.8 %
Net revenue per rental. . . . . . . . . . . . . . . . . $ 2.54 $ 2.55 $ 2.28 $ (0.01) (0.4)% $ 0.27 11.8 %
* Excludes kiosks and the impact of kiosks acquired as part of the 2012 NCR Asset Acquisition which occurred on June
22, 2012. We acquired approximately 6,200 active kiosks. Approximately 1,900 of these kiosks remained in service at
December 31, 2012. During the first quarter of 2013, we replaced 100 of these kiosks with Redbox kiosks and during
the first and second quarters of 2013, we removed but did not replace all remaining kiosks acquired. During the years
ended December 31, 2013 and 2012, kiosks acquired as part of the NCR acquisition generated revenue of
approximately $2.7 million from 0.8 million rentals and $22.0 million from 7.4 million rentals, respectively.
** Not Meaningful