Redbox 2013 Annual Report Download - page 91
Download and view the complete annual report
Please find page 91 of the 2013 Redbox annual report below. You can navigate through the pages in the report by either clicking on the pages listed below, or by using the keyword search tool below to find specific information within the annual report.-
 1
1 -
2
-
3
-
4
-
5
-
6
-
7
-
8
-
9
-
10
-
11
-
12
-
13
-
14
-
15
-
16
-
17
-
18
-
19
-
20
-
21
-
22
-
23
-
24
-
25
-
26
-
27
-
28
-
29
-
30
-
31
-
32
-
33
-
34
-
35
-
36
-
37
-
38
-
39
-
40
-
41
-
42
-
43
-
44
-
45
-
46
-
47
-
48
-
49
-
50
-
51
-
52
-
53
-
54
-
55
-
56
-
57
-
58
-
59
-
60
-
61
-
62
-
63
-
64
-
65
-
66
-
67
-
68
-
69
-
70
-
71
-
72
-
73
-
74
-
75
-
76
-
77
-
78
-
79
-
80
-
 81
81 -
 82
82 -
 83
83 -
 84
84 -
 85
85 -
 86
86 -
 87
87 -
 88
88 -
 89
89 -
 90
90 -
 91
91 -
 92
92 -
 93
93 -
 94
94 -
 95
95 -
 96
96 -
 97
97 -
 98
98 -
 99
99 -
 100
100 -
 101
101 -
102
-
103
-
104
-
105
-
106
-
107
-
108
-
109
-
110
-
111
-
112
-
113
-
114
-
115
-
116
-
117
-
118
-
119
 |
 |

82
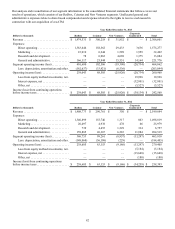
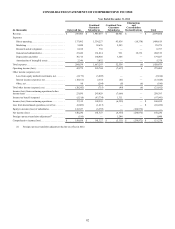
Our analysis and reconciliation of our segment information to the consolidated financial statements that follows covers our
results of operations, which consists of our Redbox, Coinstar and New Ventures segments. Unallocated general and
administrative expenses relate to share-based compensation and expense related to the rights to receive cash issued in
connection with our acquisition of ecoATM.
Year Ended December 31, 2013
Dollars in thousands Redbox Coinstar New Ventures
Corporate
Unallocated Total
Revenue . . . . . . . . . . . . . . . . . . . . . . . . . . . . . . . $ 1,974,531 $ 300,218 $ 31,852 $ — $ 2,306,601
Expenses:
Direct operating . . . . . . . . . . . . . . . . . . . . . 1,383,646 158,562 29,433 3,636 1,575,277
Marketing . . . . . . . . . . . . . . . . . . . . . . . . . . 23,010 6,244 1,589 1,559 32,402
Research and development . . . . . . . . . . . . . 78 6,962 4,669 1,375 13,084
General and administrative . . . . . . . . . . . . . 166,117 25,944 15,551 14,164 221,776
Segment operating income (loss). . . . . . . . . . . . 401,680 102,506 (19,390)(20,734) 464,062
Less: depreciation, amortization and other. (162,637) (33,921)(6,536)—
(203,094)
Operating income (loss). . . . . . . . . . . . . . . . . . . 239,043 68,585 (25,926)(20,734) 260,968
Loss from equity method investments, net.— — — 19,928 19,928
Interest expense, net . . . . . . . . . . . . . . . . . . — — — (32,801)(32,801)
Other, net . . . . . . . . . . . . . . . . . . . . . . . . . . — — — (5,527)(5,527)
Income (loss) from continuing operations
before income taxes . . . . . . . . . . . . . . . . . . . . . . $ 239,043 $ 68,585 $ (25,926)$ (39,134) $ 242,568
Year Ended December 31, 2012
Dollars in thousands Redbox Coinstar New Ventures
Corporate
Unallocated Total
Revenue . . . . . . . . . . . . . . . . . . . . . . . . . . . . . . . $ 1,908,773 $ 290,761 $ 350 $ — $ 2,199,884
Expenses:
Direct operating . . . . . . . . . . . . . . . . . . . . . 1,340,899 155,740 1,317 863 1,498,819
Marketing . . . . . . . . . . . . . . . . . . . . . . . . . . 20,497 4,938 478 66 25,979
Research and development . . . . . . . . . . . . . 739 4,455 1,229 334 6,757
General and administrative . . . . . . . . . . . . . 159,885 26,367 6,283 11,984 204,519
Segment operating income (loss). . . . . . . . . . . . 386,753 99,261 (8,957)(13,247) 463,810
Less: depreciation, amortization and other. (148,068) (36,108)(229)—
(184,405)
Operating income (loss). . . . . . . . . . . . . . . . . . . 238,685 63,153 (9,186)(13,247) 279,405
Loss from equity method investments, net.———
(5,184)(5,184)
Interest expense, net . . . . . . . . . . . . . . . . . . — — — (15,648)(15,648)
Other, net . . . . . . . . . . . . . . . . . . . . . . . . . . — — — (180)(180)
Income (loss) from continuing operations
before income taxes . . . . . . . . . . . . . . . . . . . . . . $ 238,685 $ 63,153 $ (9,186)$ (34,259) $ 258,393