Redbox 2013 Annual Report Download - page 92
Download and view the complete annual report
Please find page 92 of the 2013 Redbox annual report below. You can navigate through the pages in the report by either clicking on the pages listed below, or by using the keyword search tool below to find specific information within the annual report.-
 1
1 -
2
-
3
-
4
-
5
-
6
-
7
-
8
-
9
-
10
-
11
-
12
-
13
-
14
-
15
-
16
-
17
-
18
-
19
-
20
-
21
-
22
-
23
-
24
-
25
-
26
-
27
-
28
-
29
-
30
-
31
-
32
-
33
-
34
-
35
-
36
-
37
-
38
-
39
-
40
-
41
-
42
-
43
-
44
-
45
-
46
-
47
-
48
-
49
-
50
-
51
-
52
-
53
-
54
-
55
-
56
-
57
-
58
-
59
-
60
-
61
-
62
-
63
-
64
-
65
-
66
-
67
-
68
-
69
-
70
-
71
-
72
-
73
-
74
-
75
-
76
-
77
-
78
-
79
-
80
-
81
-
 82
82 -
 83
83 -
 84
84 -
 85
85 -
 86
86 -
 87
87 -
 88
88 -
 89
89 -
 90
90 -
 91
91 -
 92
92 -
 93
93 -
 94
94 -
 95
95 -
 96
96 -
 97
97 -
 98
98 -
 99
99 -
 100
100 -
 101
101 -
 102
102 -
103
-
104
-
105
-
106
-
107
-
108
-
109
-
110
-
111
-
112
-
113
-
114
-
115
-
116
-
117
-
118
-
119
 |
 |

83
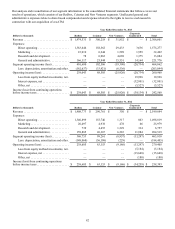
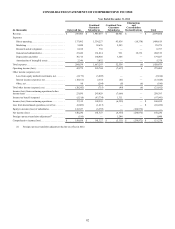
Year Ended December, 2011
Dollars in thousands Redbox Coinstar New Ventures
Corporate
Unallocated Total
Revenue . . . . . . . . . . . . . . . . . . . . . . . . . . . . . . . $ 1,561,598 $ 282,382 $ 66 $ — $ 1,844,046
Expenses:
Direct operating . . . . . . . . . . . . . . . . . . . . . 1,134,167 145,362 235 473 1,280,237
Marketing . . . . . . . . . . . . . . . . . . . . . . . . . . 22,041 6,142 217 50 28,450
Research and development . . . . . . . . . . . . . 74 6,542 617 318 7,551
General and administrative . . . . . . . . . . . . . 120,384 23,370 4,529 9,139 157,422
Segment operating income (loss). . . . . . . . . . . . 284,932 100,966 (5,532)(9,980) 370,386
Less: depreciation, amortization and other. (115,430) (31,922)(20)—
(147,372)
Operating income (loss). . . . . . . . . . . . . . . . . . . 169,502 69,044 (5,552)(9,980) 223,014
Loss from equity method investments, net.———
(1,591)(1,591)
Interest expense, net . . . . . . . . . . . . . . . . . . — — — (23,822)(23,822)
Other, net . . . . . . . . . . . . . . . . . . . . . . . . . . — — — 256 256
Income (loss) from continuing operations
before income taxes . . . . . . . . . . . . . . . . . . . . . . $ 169,502 $ 69,044 $ (5,552)$ (35,137) $ 197,857
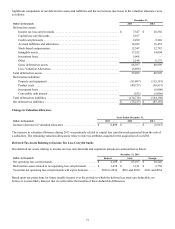
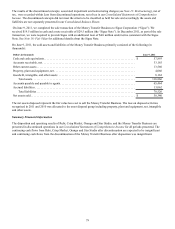
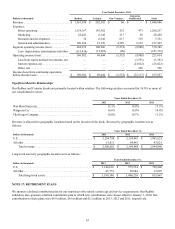
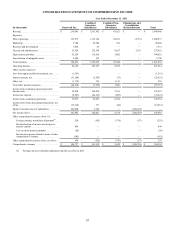
Significant Retailer Relationships
Our Redbox and Coinstar kiosks are primarily located within retailers. The following retailers accounted for 10.0% or more of
our consolidated revenue:
Years Ended December 31,
2013 2012 2011
Wal-Mart Stores Inc.. . . . . . . . . . . . . . . . . . . . . . . . . . . . . . . . . . . . . 15.3% 16.0% 17.5%
Walgreen Co. . . . . . . . . . . . . . . . . . . . . . . . . . . . . . . . . . . . . . . . . . . 14.6% 16.0% 16.0%
The Kroger Company . . . . . . . . . . . . . . . . . . . . . . . . . . . . . . . . . . . . 10.0% 10.7% 11.2%
Revenue is allocated to geographic locations based on the location of the kiosk. Revenue by geographic location was as
follows:
Years Ended December 31,
Dollars in thousands 2013 2012 2011
U.S. . . . . . . . . . . . . . . . . . . . . . . . . . . . . . . . . . . . . . . . . . . . . . . . . . . $ 2,254,790 $ 2,154,943 $ 1,801,025
All other . . . . . . . . . . . . . . . . . . . . . . . . . . . . . . . . . . . . . . . . . . . . . . 51,811 44,941 43,021
Total revenue . . . . . . . . . . . . . . . . . . . . . . . . . . . . . . . . . . . . . . . $ 2,306,601 $ 2,199,884 $ 1,844,046
Long-lived assets by geographic location were as follows:
Years Ended December 31,
Dollars in thousands 2013 2012 2011
U.S. . . . . . . . . . . . . . . . . . . . . . . . . . . . . . . . . . . . . . . . . . . . . . . . . . $ 1,146,616 $ 975,334 $ 798,840
All other . . . . . . . . . . . . . . . . . . . . . . . . . . . . . . . . . . . . . . . . . . . . . . 43,774 30,884 17,007
Total long-lived assets . . . . . . . . . . . . . . . . . . . . . . . . . . . . . . . $ 1,190,390 $ 1,006,218 $ 815,847
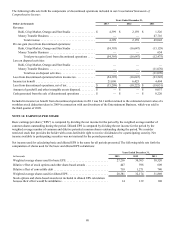
NOTE 17: RETIREMENT PLANS
We sponsor a defined contribution plan for our employees who satisfy certain age and service requirements. Our Redbox
subsidiary also sponsors a defined contribution plan to which new contributions were frozen effective January 1, 2010. Our
contributions to these plans were $4.9 million, $4.0 million and $3.2 million in 2013, 2012 and 2011, respectively.