Redbox 2013 Annual Report Download - page 102
Download and view the complete annual report
Please find page 102 of the 2013 Redbox annual report below. You can navigate through the pages in the report by either clicking on the pages listed below, or by using the keyword search tool below to find specific information within the annual report.-
 1
1 -
2
-
3
-
4
-
5
-
6
-
7
-
8
-
9
-
10
-
11
-
12
-
13
-
14
-
15
-
16
-
17
-
18
-
19
-
20
-
21
-
22
-
23
-
24
-
25
-
26
-
27
-
28
-
29
-
30
-
31
-
32
-
33
-
34
-
35
-
36
-
37
-
38
-
39
-
40
-
41
-
42
-
43
-
44
-
45
-
46
-
47
-
48
-
49
-
50
-
51
-
52
-
53
-
54
-
55
-
56
-
57
-
58
-
59
-
60
-
61
-
62
-
63
-
64
-
65
-
66
-
67
-
68
-
69
-
70
-
71
-
72
-
73
-
74
-
75
-
76
-
77
-
78
-
79
-
80
-
81
-
82
-
83
-
84
-
85
-
86
-
87
-
88
-
89
-
90
-
91
-
 92
92 -
 93
93 -
 94
94 -
 95
95 -
 96
96 -
 97
97 -
 98
98 -
 99
99 -
 100
100 -
 101
101 -
 102
102 -
 103
103 -
 104
104 -
 105
105 -
 106
106 -
 107
107 -
 108
108 -
 109
109 -
 110
110 -
 111
111 -
 112
112 -
113
-
114
-
115
-
116
-
117
-
118
-
119
 |
 |

93
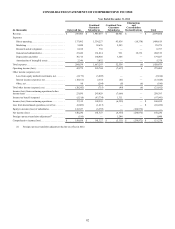
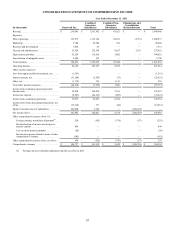
CONSOLIDATED STATEMENTS OF COMPREHENSIVE INCOME
Year Ended December 31, 2011
(in thousands) Outerwall Inc.
Combined
Guarantor
Subsidiaries
Combined Non-
Guarantor
Subsidiaries
Eliminations and
Consolidation
Reclassifications Total
Revenue . . . . . . . . . . . . . . . . . . . . . . . . . . . . . . . . $ 239,043 $ 1,561,982 $ 43,021 $ — $ 1,844,046
Expenses:
Direct operating . . . . . . . . . . . . . . . . . . . . . . . . . . 123,975 1,135,194 24,621 (3,553) 1,280,237
Marketing. . . . . . . . . . . . . . . . . . . . . . . . . . . . . . . 5,784 22,300 366 — 28,450
Research and development . . . . . . . . . . . . . . . . . 7,466 85 — — 7,551
General and administrative . . . . . . . . . . . . . . . . . 19,554 125,358 8,957 3,553 157,422
Depreciation and other. . . . . . . . . . . . . . . . . . . . . 25,524 116,106 3,002 — 144,632
Amortization of intangible assets. . . . . . . . . . . . . 2,548 192 — — 2,740
Total expenses . . . . . . . . . . . . . . . . . . . . . . . . . . . 184,851 1,399,235 36,946 — 1,621,032
Operating income. . . . . . . . . . . . . . . . . . . . . . . . . 54,192 162,747 6,075 — 223,014
Other income (expense):
Loss from equity method investments, net . . . . . (1,591) — — — (1,591)
Interest expense, net. . . . . . . . . . . . . . . . . . . . . . . (21,564) (2,245) (13) — (23,822)
Other, net . . . . . . . . . . . . . . . . . . . . . . . . . . . . . . . (1,179) 316 1,119 — 256
Total other income (expense). . . . . . . . . . . . . . . . (24,334) (1,929) 1,106 — (25,157)
Income from continuing operations before
income taxes. . . . . . . . . . . . . . . . . . . . . . . . . . . . . 29,858 160,818 7,181 — 197,857
Income tax expense . . . . . . . . . . . . . . . . . . . . . . . (9,901) (64,123) (899) — (74,923)
Income from continuing operations. . . . . . . . . . . 19,957 96,695 6,282 — 122,934
Income (loss) from discontinued operations, net
of tax . . . . . . . . . . . . . . . . . . . . . . . . . . . . . . . . . . (19,164) 177 (64) — (19,051)
Equity in income (loss) of subsidiaries . . . . . . . . 103,090 5,149 — (108,239) —
Net income (loss) . . . . . . . . . . . . . . . . . . . . . . . . . 103,883 102,021 6,218 (108,239) 103,883
Other comprehensive income (Note 15):
Foreign currency translation adjustment(1). . . 320 (102) (376) (97) (255)
Reclassification of interest rate hedges to
interest expense . . . . . . . . . . . . . . . . . . . . . . . 896 — — — 896
Loss on short-term investments . . . . . . . . . . . (20) — — — (20)
Income tax expense related to items of other
comprehensive income. . . . . . . . . . . . . . . . . . (342) — — — (342)
Other comprehensive income (loss), net of tax . . 854 (102) (376) (97) 279
Comprehensive income . . . . . . . . . . . . . . . . . . . . $ 104,737 $ 101,919 $ 5,842 $ (108,336) $ 104,162
(1) Foreign currency translation adjustment had no tax effect in 2011.