Redbox 2013 Annual Report Download - page 43
Download and view the complete annual report
Please find page 43 of the 2013 Redbox annual report below. You can navigate through the pages in the report by either clicking on the pages listed below, or by using the keyword search tool below to find specific information within the annual report.-
 1
1 -
2
-
3
-
4
-
5
-
6
-
7
-
8
-
9
-
10
-
11
-
12
-
13
-
14
-
15
-
16
-
17
-
18
-
19
-
20
-
21
-
22
-
23
-
24
-
25
-
26
-
27
-
28
-
29
-
30
-
31
-
32
-
 33
33 -
 34
34 -
 35
35 -
 36
36 -
 37
37 -
 38
38 -
 39
39 -
 40
40 -
 41
41 -
 42
42 -
 43
43 -
 44
44 -
 45
45 -
 46
46 -
 47
47 -
 48
48 -
 49
49 -
 50
50 -
 51
51 -
 52
52 -
 53
53 -
54
-
55
-
56
-
57
-
58
-
59
-
60
-
61
-
62
-
63
-
64
-
65
-
66
-
67
-
68
-
69
-
70
-
71
-
72
-
73
-
74
-
75
-
76
-
77
-
78
-
79
-
80
-
81
-
82
-
83
-
84
-
85
-
86
-
87
-
88
-
89
-
90
-
91
-
92
-
93
-
94
-
95
-
96
-
97
-
98
-
99
-
100
-
101
-
102
-
103
-
104
-
105
-
106
-
107
-
108
-
109
-
110
-
111
-
112
-
113
-
114
-
115
-
116
-
117
-
118
-
119
 |
 |

34
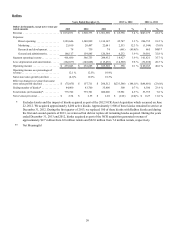
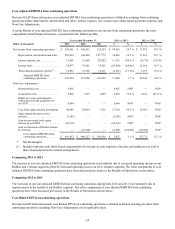
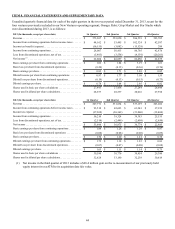
Core Adjusted EBITDA from continuing operations
Our non-GAAP financial measure core adjusted EBITDA from continuing operations is defined as earnings from continuing
operations before depreciation, amortization and other; interest expense, net; income taxes; share-based payments expense; and
Non-Core Adjustments.
A reconciliation of core adjusted EBITDA from continuing operations to net income from continuing operations, the most
comparable GAAP financial measure, is presented in the following table:
Years ended December 31, 2013 vs. 2012 2012 vs. 2011
Dollars in thousands 2013 2012 2011 $ % $ %
Net income from continuing operations . . . $ 208,091 $ 160,452 122,934 $ 47,639 29.7 % $ 37,518 30.5 %
Depreciation, amortization and other .203,094 184,405 147,372 18,689 10.1 % 37,033 25.1 %
Interest expense, net . . . . . . . . . . . . . . 32,801 15,648 23,822 17,153 109.6 % (8,174) (34.3)%
Income taxes . . . . . . . . . . . . . . . . . . . . 34,477 97,941 74,923 (63,464) (64.8)% 23,018 30.7 %
Share-based payments expense(1). . . . 16,831 19,362 16,211 (2,531) (13.1)% 3,151 19.4 %
Adjusted EBITDA from
continuing operations . . . . . . . . . 495,294 477,808 385,262 17,486 3.7 % 92,546 24.0 %
Non-Core Adjustments:
Restructuring costs . . . . . . . . . . . . . . . 4,495 — — 4,495 NM* — NM*
Acquisition costs. . . . . . . . . . . . . . . . . 5,669 3,235 1,603 2,434 75.2 % 1,632 101.8 %
Rights to receive cash issued in
connection with the acquisition of
ecoATM . . . . . . . . . . . . . . . . . . . . . . . 8,664 — —8,664 NM* — NM*
Loss from equity method investments 48,448 24,684 1,591 23,764 96.3 % 23,093 NM*
Sigue indemnification reserve
releases . . . . . . . . . . . . . . . . . . . . . . . . (2,542) — — (2,542) NM* — NM*
Gain on previously held equity
interest on ecoATM. . . . . . . . . . . . . . . (68,376) — — (68,376) NM* — NM*
Gain on formation of Redbox Instant
by Verizon. . . . . . . . . . . . . . . . . . . . . . — (19,500) — 19,500 (100.0)% (19,500) NM*
Core adjusted EBITDA from
continuing operations . . . . . . . . . $ 491,652 $ 486,227 $ 388,456 $ 5,425 1.1 % 97,771 25.2 %
* Not Meaningful
(1) Includes both non-cash share-based compensation for executives, non-employee directors and employees as well as
share-based payments for content arrangements.
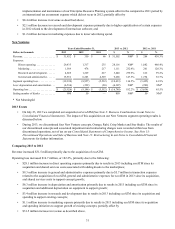
Comparing 2013 to 2012
The increase in our core adjusted EBITDA from continuing operations was primarily due to increased operating income in our
Redbox and Coinstar segments offset by increased operating loss in our New Ventures segment. The other components of core
adjusted EBITDA from continuing operations have been discussed previously in the Results of Operations section above.
Comparing 2012 to 2011
The increases in our core adjusted EBITDA from continuing operations during both 2012 and 2011 were primarily due to
improvements in the results of our Redbox segment. The other components of core adjusted EBITDA from continuing
operations have been discussed previously in the Results of Operations section above.
Core Diluted EPS from continuing operations
Our non-GAAP financial measure core diluted EPS from continuing operations is defined as diluted earnings per share from
continuing operations excluding Non-Core Adjustments, net of applicable taxes.