Redbox 2013 Annual Report Download - page 100
Download and view the complete annual report
Please find page 100 of the 2013 Redbox annual report below. You can navigate through the pages in the report by either clicking on the pages listed below, or by using the keyword search tool below to find specific information within the annual report.-
 1
1 -
2
-
3
-
4
-
5
-
6
-
7
-
8
-
9
-
10
-
11
-
12
-
13
-
14
-
15
-
16
-
17
-
18
-
19
-
20
-
21
-
22
-
23
-
24
-
25
-
26
-
27
-
28
-
29
-
30
-
31
-
32
-
33
-
34
-
35
-
36
-
37
-
38
-
39
-
40
-
41
-
42
-
43
-
44
-
45
-
46
-
47
-
48
-
49
-
50
-
51
-
52
-
53
-
54
-
55
-
56
-
57
-
58
-
59
-
60
-
61
-
62
-
63
-
64
-
65
-
66
-
67
-
68
-
69
-
70
-
71
-
72
-
73
-
74
-
75
-
76
-
77
-
78
-
79
-
80
-
81
-
82
-
83
-
84
-
85
-
86
-
87
-
88
-
89
-
 90
90 -
 91
91 -
 92
92 -
 93
93 -
 94
94 -
 95
95 -
 96
96 -
 97
97 -
 98
98 -
 99
99 -
 100
100 -
 101
101 -
 102
102 -
 103
103 -
 104
104 -
 105
105 -
 106
106 -
 107
107 -
 108
108 -
 109
109 -
 110
110 -
111
-
112
-
113
-
114
-
115
-
116
-
117
-
118
-
119
 |
 |

91
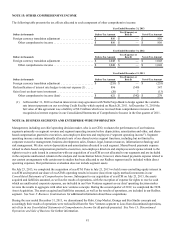
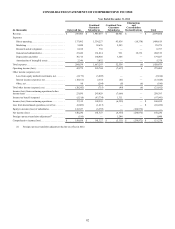
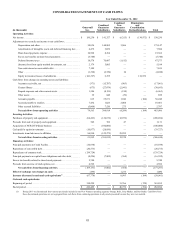
CONSOLIDATED STATEMENTS OF COMPREHENSIVE INCOME
Year Ended December 31, 2013
(in thousands) Outerwall Inc.
Combined
Guarantor
Subsidiaries
Combined Non-
Guarantor
Subsidiaries
Eliminations
and
Consolidation
Reclassifications Total
Revenue . . . . . . . . . . . . . . . . . . . . . . . . . . . . . . . . . . . . . $ 255,251 $ 1,999,539 $ 51,811 $ — $ 2,306,601
Expenses:
Direct operating. . . . . . . . . . . . . . . . . . . . . . . . . . . . 138,859 1,394,932 54,433 (12,947) 1,575,277
Marketing . . . . . . . . . . . . . . . . . . . . . . . . . . . . . . . . 6,540 23,269 2,593 — 32,402
Research and development . . . . . . . . . . . . . . . . . . . 8,973 4,111 — — 13,084
General and administrative . . . . . . . . . . . . . . . . . . . 33,747 171,505 3,569 12,955 221,776
Depreciation and other . . . . . . . . . . . . . . . . . . . . . . 28,101 158,801 5,259 — 192,161
Amortization of intangible assets . . . . . . . . . . . . . . 2,245 8,688 — — 10,933
Total expenses . . . . . . . . . . . . . . . . . . . . . . . . . . . . . . . . 218,465 1,761,306 65,854 8 2,045,633
Operating income (loss) . . . . . . . . . . . . . . . . . . . . . . . . 36,786 238,233 (14,043) (8) 260,968
Other income (expense), net:
Income (loss) from equity method investments,
net . . . . . . . . . . . . . . . . . . . . . . . . . . . . . . . . . . . . . . 65,063 (45,135) — — 19,928
Interest expense, net . . . . . . . . . . . . . . . . . . . . . . . . (32,930) 257 (128) — (32,801)
Other, net . . . . . . . . . . . . . . . . . . . . . . . . . . . . . . . . . (3,868) 258 (1,925) 8 (5,527)
Total other income (expense), net . . . . . . . . . . . . . . . . . 28,265 (44,620) (2,053) 8 (18,400)
Income (loss) from continuing operations before
income taxes . . . . . . . . . . . . . . . . . . . . . . . . . . . . . . . . . 65,051 193,613 (16,096) — 242,568
Income tax benefit (expense) . . . . . . . . . . . . . . . . . . . . 30,893 (70,429) 5,059 — (34,477)
Income from continuing operations . . . . . . . . . . . . . . . 95,944 123,184 (11,037) — 208,091
Loss from discontinued operations, net of tax . . . . . . . (30,834) (2,465) — — (33,299)
Equity in income (loss) of subsidiaries . . . . . . . . . . . . . 109,682 (11,037) — (98,645) —
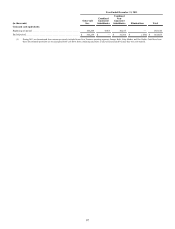
Net Income (loss) . . . . . . . . . . . . . . . . . . . . . . . . . . . . . 174,792 109,682 (11,037) (98,645) 174,792
Foreign currency translation adjustment(1) . . . . . . . . . . (105) — 961 — 856
Comprehensive income (loss) . . . . . . . . . . . . . . . . . . . . $ 174,687 $ 109,682 $ (10,076) $ (98,645) $ 175,648
(1) Foreign currency translation adjustment had no tax effect in 2013.