Redbox 2013 Annual Report Download - page 31
Download and view the complete annual report
Please find page 31 of the 2013 Redbox annual report below. You can navigate through the pages in the report by either clicking on the pages listed below, or by using the keyword search tool below to find specific information within the annual report.-
 1
1 -
2
-
3
-
4
-
5
-
6
-
7
-
8
-
9
-
10
-
11
-
12
-
13
-
14
-
15
-
16
-
17
-
18
-
19
-
20
-
 21
21 -
 22
22 -
 23
23 -
 24
24 -
 25
25 -
 26
26 -
 27
27 -
 28
28 -
 29
29 -
 30
30 -
 31
31 -
 32
32 -
 33
33 -
 34
34 -
 35
35 -
 36
36 -
 37
37 -
 38
38 -
 39
39 -
 40
40 -
 41
41 -
42
-
43
-
44
-
45
-
46
-
47
-
48
-
49
-
50
-
51
-
52
-
53
-
54
-
55
-
56
-
57
-
58
-
59
-
60
-
61
-
62
-
63
-
64
-
65
-
66
-
67
-
68
-
69
-
70
-
71
-
72
-
73
-
74
-
75
-
76
-
77
-
78
-
79
-
80
-
81
-
82
-
83
-
84
-
85
-
86
-
87
-
88
-
89
-
90
-
91
-
92
-
93
-
94
-
95
-
96
-
97
-
98
-
99
-
100
-
101
-
102
-
103
-
104
-
105
-
106
-
107
-
108
-
109
-
110
-
111
-
112
-
113
-
114
-
115
-
116
-
117
-
118
-
119
 |
 |

22
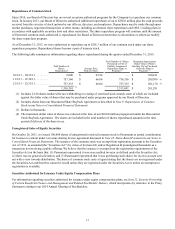
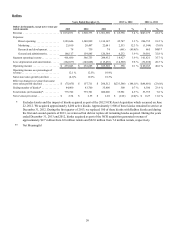
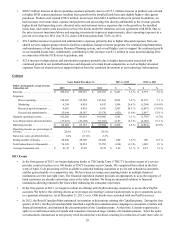
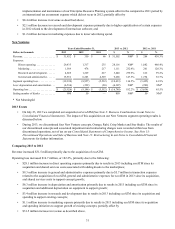
Consolidated Results
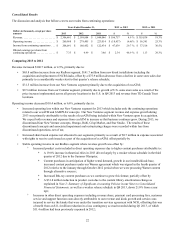
The discussion and analysis that follows covers our results from continuing operations:
Years Ended December 31, 2013 vs. 2012 2012 vs. 2011
Dollars in thousands, except per share
amounts 2013 2012 2011 $%$%
Revenue. . . . . . . . . . . . . . . . . . . . . . . . . $ 2,306,601 $ 2,199,884 $ 1,844,046 $ 106,717 4.9 % $ 355,838 19.3%
Operating income . . . . . . . . . . . . . . . . . $ 260,968 $ 279,405 $ 223,014 $ (18,437) (6.6)% $ 56,391 25.3%
Income from continuing operations . . . $ 208,091 $ 160,452 $ 122,934 $ 47,639 29.7 % $ 37,518 30.5%
Diluted earnings per share from
continuing operations . . . . . . . . . . . . . . $ 7.33 $ 4.99 $ 3.86 $ 2.34 46.9 % $ 1.13 29.3%
Comparing 2013 to 2012
Revenue increased $106.7 million, or 4.9%, primarily due to:
• $65.8 million increase from our Redbox segment, $141.7 million from new kiosk installations including the
acquisition and replacement of NCR kiosks, offset by a $75.9 million decrease from a decline in same store sales due
primarily to a considerably weaker start to first quarter’s release schedule;
• $31.5 million increase from our New Ventures segment primarily due to the acquisition of ecoATM;
• $9.5 million increase from our Coinstar segment, primarily due to growth of U.S. same store sales as a result of the
price increase implemented across all grocery locations in the U.S. in Q4 2013 and revenue from TD Canada Trust
locations.
Operating income decreased $18.4 million, or 6.6%, primarily due to:
• Increased operating loss within our New Ventures segment for 2013 which includes only the continuing operations
related to our ecoATM and SAMPLEit concepts. Our New Ventures segment revenue and expense growth during
2013 was primarily attributable to the results of ecoATM being included within New Ventures upon its acquisition.
We expect both revenues and expenses from ecoATM to increase as that business continues grow. During 2013, we
discontinued four New Venture concepts, Orango, Rubi, Crisp Market, and Star Studio. The results of these
discontinued concepts and associated impairment and restructuring charges were recorded within loss from
discontinued operations, net of tax;
• Increased share based expense not allocated to our segments primarily as a result of $8.7 million in expense associated
with rights to receive cash issued as a part of the acquisition of ecoATM; offset partially by
• Stable operating income in our Redbox segment where revenue growth was offset by:
Increased product costs included in direct operating expenses due to higher content purchases attributable to:
A 19.0% increase in theatrical titles in 2013 driven largely by a weaker release schedule in the third
quarter of 2012 due to the Summer Olympics;
Content purchases in anticipation of higher rental demand, growth in our installed kiosk base,
increased content purchases under our Warner agreement which was signed in the fourth quarter of
2012 relative to the January through October 2012 period when we were procuring Warner content
through alternative sources;
Increased Blu-ray content purchases as we continue to grow this format; partially offset by
A $31.8 million reduction in product costs due to the content library amortization change as
explained in Note 2: Summary of Significant Accounting Policies in our Notes to Consolidated
Financial Statements, as well as a weaker release schedule in Q4 2013, down 21.0% from a year
ago;
Increases in other direct operating expenses including revenue share, payment card processing fees, customer
service and support function costs directly attributable to our revenue and kiosk growth and certain costs
incurred to service the kiosks that were under the transition services agreement with NCR, offsetting this was
a benefit from an $11.4 million reduction in a loss contingency accrual recorded during Q1 2013, of which
$11.4 million had been previously expensed in 2012;