Redbox 2013 Annual Report Download - page 39
Download and view the complete annual report
Please find page 39 of the 2013 Redbox annual report below. You can navigate through the pages in the report by either clicking on the pages listed below, or by using the keyword search tool below to find specific information within the annual report.-
 1
1 -
2
-
3
-
4
-
5
-
6
-
7
-
8
-
9
-
10
-
11
-
12
-
13
-
14
-
15
-
16
-
17
-
18
-
19
-
20
-
21
-
22
-
23
-
24
-
25
-
26
-
27
-
28
-
 29
29 -
 30
30 -
 31
31 -
 32
32 -
 33
33 -
 34
34 -
 35
35 -
 36
36 -
 37
37 -
 38
38 -
 39
39 -
 40
40 -
 41
41 -
 42
42 -
 43
43 -
 44
44 -
 45
45 -
 46
46 -
 47
47 -
 48
48 -
 49
49 -
50
-
51
-
52
-
53
-
54
-
55
-
56
-
57
-
58
-
59
-
60
-
61
-
62
-
63
-
64
-
65
-
66
-
67
-
68
-
69
-
70
-
71
-
72
-
73
-
74
-
75
-
76
-
77
-
78
-
79
-
80
-
81
-
82
-
83
-
84
-
85
-
86
-
87
-
88
-
89
-
90
-
91
-
92
-
93
-
94
-
95
-
96
-
97
-
98
-
99
-
100
-
101
-
102
-
103
-
104
-
105
-
106
-
107
-
108
-
109
-
110
-
111
-
112
-
113
-
114
-
115
-
116
-
117
-
118
-
119
 |
 |
30
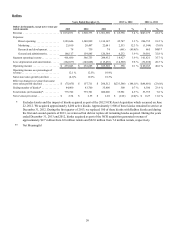
Canada. We believe that Canadian customers will take longer to accumulate coins because consumers no longer will
be accumulating pennies.
• Effective October 1, 2013, we implemented a price increase for all U. S. grocery retail locations for the coin voucher
product taking the rate from 9.8% to 10.9% in order to offset increased operating costs such as revenue share
payments to retailers, transportation, and processing expenses since the last price increase taken in February 2010.
Starting in June 2012, we conducted extensive consumer survey research around price sensitivity with results
demonstrating no meaningful reduction in volumes and accordingly, we made the decision to move forward with the
price increase.
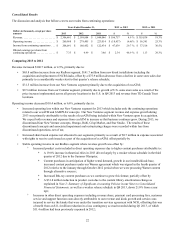
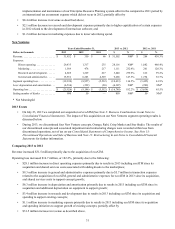
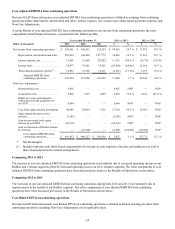
Comparing 2013 to 2012
Revenue increased $9.5 million, or 3.3%, primarily due to growth of U.S. same store sales and revenue from TDCT locations.
The increase in same store sales in the U.S. was driven by the price increase implemented across all grocery locations in the
U.S. The average coin-to-voucher transaction size continued to increase and the volume of non-cash voucher products
increased by 0.3%. Revenue increased at a rate lower than the increase in transaction size due to variations in country and
product mix, including growth in Canada driven by TDCT, which has a different revenue model than regular coin-to-voucher
transactions. Same store sales grew in the U.S. driven by growth from the fee increase in Q4 2013, and the fact that revenue
from kiosks installed in 2011 was fully included in this year's same store sales measurement. This was slightly offset by
reduced same store sales in the UK and Canada.
Operating income increased $5.4 million, or 8.6%, primarily due to the following:
• $9.5 million increase in revenue as described above; and
• $2.2 million decrease in depreciation and amortization expense due to incremental expense associated with one-time
expense for internal use software in the nine months ended September 30, 2012 for $2.5 million which did not recur in
2013, offset by lower machine disposal losses; partially offset by
• $1.3 million increase in marketing expenses primarily due to timing of advertising and spending to support our
programs in 2013;
• $2.8 million increase in direct operating expenses primarily due to higher revenue share expense attributable to both
revenue growth and increased revenue share rates with certain retail partners as a result of long-term contract
renewals; higher coin processing and transportation related expenses arising from higher revenue and incremental
costs to outsource the transportation function in Canada in 2013; and
• $2.5 million increase in research and development expenses primarily due to an increase in kiosk software and
hardware engineering efforts for our Coinstar and gift card exchange business kiosks.
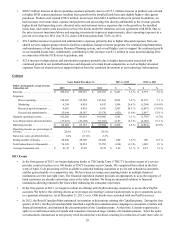
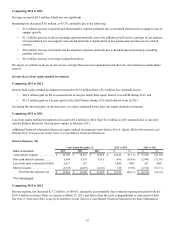
Comparing 2012 to 2011
Revenue increased $8.4 million, or 3.0%, primarily due to growth in our kiosk base, growth in larger than average coin-to-
voucher transactions over the comparative period and increased transactions related to our coin-to-prepaid products, which
typically have a larger transaction size than coin to voucher transactions, resulting in a $0.52 increase in average transaction
size to $39.30 over the comparative period.
Operating income decreased $5.9 million, or 8.5%, primarily due to the following:
• $10.4 million increase in direct operating expenses primarily due to higher revenue share expense from both revenue
growth and increased revenue share rates with certain retail partners as a result of long-term contract renewals, higher
kiosk telecommunication expenses as a result of the increased number of kiosks and our shift towards more real time
connectivity, higher coin processing and transportation related expenses arising from both higher revenue in 2012
offset in the comparative 2011 period by a credit received for previously-processed mutilated coin, and higher
allocated expenses from the shared services sales function;
• $4.2 million increase in depreciation and amortization expenses primarily due to higher allocated expenses from our
shared services support function from the continued investment in our technology infrastructure and expensing certain
internal use software, as well as higher depreciation arising from an increase in the number of kiosks deployed
principally due to the Safeway relationship we entered into in 2011, and
• $3.0 million increase in general and administrative expenses primarily due to higher allocated expenses from our
shared services support group related to facilities expansion, human resource programs and the continued