Redbox 2013 Annual Report Download - page 71
Download and view the complete annual report
Please find page 71 of the 2013 Redbox annual report below. You can navigate through the pages in the report by either clicking on the pages listed below, or by using the keyword search tool below to find specific information within the annual report.-
 1
1 -
2
-
3
-
4
-
5
-
6
-
7
-
8
-
9
-
10
-
11
-
12
-
13
-
14
-
15
-
16
-
17
-
18
-
19
-
20
-
21
-
22
-
23
-
24
-
25
-
26
-
27
-
28
-
29
-
30
-
31
-
32
-
33
-
34
-
35
-
36
-
37
-
38
-
39
-
40
-
41
-
42
-
43
-
44
-
45
-
46
-
47
-
48
-
49
-
50
-
51
-
52
-
53
-
54
-
55
-
56
-
57
-
58
-
59
-
60
-
 61
61 -
 62
62 -
 63
63 -
 64
64 -
 65
65 -
 66
66 -
 67
67 -
 68
68 -
 69
69 -
 70
70 -
 71
71 -
 72
72 -
 73
73 -
 74
74 -
 75
75 -
 76
76 -
 77
77 -
 78
78 -
 79
79 -
 80
80 -
 81
81 -
82
-
83
-
84
-
85
-
86
-
87
-
88
-
89
-
90
-
91
-
92
-
93
-
94
-
95
-
96
-
97
-
98
-
99
-
100
-
101
-
102
-
103
-
104
-
105
-
106
-
107
-
108
-
109
-
110
-
111
-
112
-
113
-
114
-
115
-
116
-
117
-
118
-
119
 |
 |

62
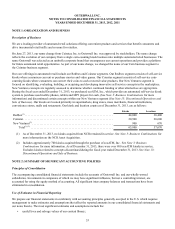
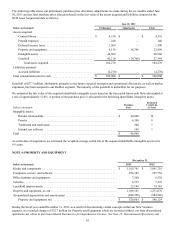
The following table shows our preliminary purchase price allocation, adjustments we made during the six months ended June
30, 2013 and our final purchase price allocation based on the fair value of the assets acquired and liabilities assumed at the
NCR Asset Acquisition date as follows:
June 22, 2012
Dollars in thousands Preliminary Adjustments Final
Assets acquired:
Content library . . . . . . . . . . . . . . . . . . . . . . . . . . . . . . . . . . . . . . . $ 4,330 $ — $ 4,330
Prepaid expenses . . . . . . . . . . . . . . . . . . . . . . . . . . . . . . . . . . . . . 240 — 240
Deferred income taxes . . . . . . . . . . . . . . . . . . . . . . . . . . . . . . . . . 1,500 — 1,500
Property and equipment . . . . . . . . . . . . . . . . . . . . . . . . . . . . . . . . 9,130 14,766 23,896
Intangible assets. . . . . . . . . . . . . . . . . . . . . . . . . . . . . . . . . . . . . . 46,960 — 46,960
Goodwill . . . . . . . . . . . . . . . . . . . . . . . . . . . . . . . . . . . . . . . . . . . 42,110 (14,766) 27,344
Total assets acquired. . . . . . . . . . . . . . . . . . . . . . . . . . . . . . . 104,270 — 104,270
Liabilities assumed:
Accrued liabilities . . . . . . . . . . . . . . . . . . . . . . . . . . . . . . . . . . . . (4,270)—
(4,270)
Total consideration paid in cash . . . . . . . . . . . . . . . . . . . . . . . . . . . . . $ 100,000 $ — $ 100,000
Goodwill of $27.3 million, attributable primarily to the future expected synergies and operational efficiencies, as well as market
expansion, has been assigned to our Redbox segment. The majority of the goodwill is deductible for tax purposes.
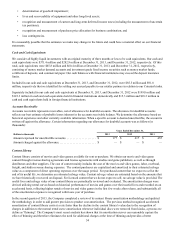
We estimated the fair value of the acquired identifiable intangible assets based on the forecasted future cash flows discounted at
a rate of approximately 11.0%. A portion of the purchase price is allocated to the following identifiable intangible assets:
Dollars in thousands
Purchase
Price
Estimated
Useful Life
in Years
Intangible assets:
Retailer relationships . . . . . . . . . . . . . . . . . . . . . . . . . . . . . . . . . . . . . . . . . . . . . . . . . . $ 40,000 10
Patents . . . . . . . . . . . . . . . . . . . . . . . . . . . . . . . . . . . . . . . . . . . . . . . . . . . . . . . . . . . . . 6,300 8
Trademark and trade name . . . . . . . . . . . . . . . . . . . . . . . . . . . . . . . . . . . . . . . . . . . . . 500 1
Internal use software . . . . . . . . . . . . . . . . . . . . . . . . . . . . . . . . . . . . . . . . . . . . . . . . . . 160 1
Total . . . . . . . . . . . . . . . . . . . . . . . . . . . . . . . . . . . . . . . . . . . . . . . . . . . . . . . . . . . . . . . . . . $ 46,960
As of the date of acquisition, we estimated the weighted-average useful life of the acquired identifiable intangible assets to be
9.6 years.
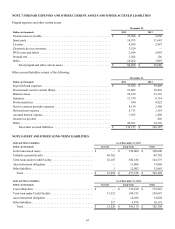
NOTE 4: PROPERTY AND EQUIPMENT
December 31,
Dollars in thousands 2013 2012
Kiosks and components . . . . . . . . . . . . . . . . . . . . . . . . . . . . . . . . . . . . . . . . . . . . . . . . . . . $ 1,105,761 $ 1,041,755
Computers, servers, and software. . . . . . . . . . . . . . . . . . . . . . . . . . . . . . . . . . . . . . . . . . . . 226,389 195,756
Office furniture and equipment. . . . . . . . . . . . . . . . . . . . . . . . . . . . . . . . . . . . . . . . . . . . . . 7,260 6,538
Vehicles. . . . . . . . . . . . . . . . . . . . . . . . . . . . . . . . . . . . . . . . . . . . . . . . . . . . . . . . . . . . . . . . 6,553 7,278
Leasehold improvements . . . . . . . . . . . . . . . . . . . . . . . . . . . . . . . . . . . . . . . . . . . . . . . . . . 23,198 19,743
Property and equipment, at cost . . . . . . . . . . . . . . . . . . . . . . . . . . . . . . . . . . . . . . . . . . . . . 1,369,161 1,271,070
Accumulated depreciation and amortization . . . . . . . . . . . . . . . . . . . . . . . . . . . . . . . . . . . (848,296)(684,946)
Property and equipment, net . . . . . . . . . . . . . . . . . . . . . . . . . . . . . . . . . . . . . . . . . . . . $ 520,865 $ 586,124
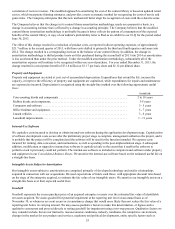
During the fiscal year ended December 31, 2013, as a result of discontinuing certain concepts within our New Ventures
segment, we recorded charges of $32.7 million for Property and Equipment which are recorded within Loss from discontinued
operations, net of tax in our Consolidated Statements of Comprehensive Income. See Note 13: Discontinued Operations and