Redbox 2013 Annual Report Download - page 57
Download and view the complete annual report
Please find page 57 of the 2013 Redbox annual report below. You can navigate through the pages in the report by either clicking on the pages listed below, or by using the keyword search tool below to find specific information within the annual report.-
 1
1 -
2
-
3
-
4
-
5
-
6
-
7
-
8
-
9
-
10
-
11
-
12
-
13
-
14
-
15
-
16
-
17
-
18
-
19
-
20
-
21
-
22
-
23
-
24
-
25
-
26
-
27
-
28
-
29
-
30
-
31
-
32
-
33
-
34
-
35
-
36
-
37
-
38
-
39
-
40
-
41
-
42
-
43
-
44
-
45
-
46
-
 47
47 -
 48
48 -
 49
49 -
 50
50 -
 51
51 -
 52
52 -
 53
53 -
 54
54 -
 55
55 -
 56
56 -
 57
57 -
 58
58 -
 59
59 -
 60
60 -
 61
61 -
 62
62 -
 63
63 -
 64
64 -
 65
65 -
 66
66 -
 67
67 -
68
-
69
-
70
-
71
-
72
-
73
-
74
-
75
-
76
-
77
-
78
-
79
-
80
-
81
-
82
-
83
-
84
-
85
-
86
-
87
-
88
-
89
-
90
-
91
-
92
-
93
-
94
-
95
-
96
-
97
-
98
-
99
-
100
-
101
-
102
-
103
-
104
-
105
-
106
-
107
-
108
-
109
-
110
-
111
-
112
-
113
-
114
-
115
-
116
-
117
-
118
-
119
 |
 |

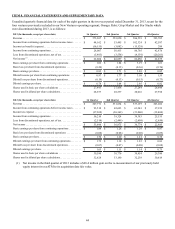
48
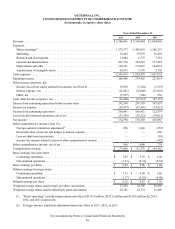
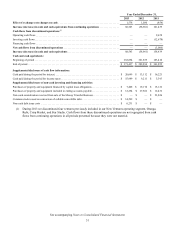
OUTERWALL INC.
CONSOLIDATED STATEMENTS OF COMPREHENSIVE INCOME
(in thousands, except per share data)
Year Ended December 31,
2013 2012 2011
Revenue . . . . . . . . . . . . . . . . . . . . . . . . . . . . . . . . . . . . . . . . . . . . . . . . . . . . . . . . . . . . $ 2,306,601 $ 2,199,884 $ 1,844,046
Expenses:
Direct operating(1) . . . . . . . . . . . . . . . . . . . . . . . . . . . . . . . . . . . . . . . . . . . . . . . . . . 1,575,277 1,498,819 1,280,237
Marketing . . . . . . . . . . . . . . . . . . . . . . . . . . . . . . . . . . . . . . . . . . . . . . . . . . . . . . . . 32,402 25,979 28,450
Research and development . . . . . . . . . . . . . . . . . . . . . . . . . . . . . . . . . . . . . . . . . . . 13,084 6,757 7,551
General and administrative . . . . . . . . . . . . . . . . . . . . . . . . . . . . . . . . . . . . . . . . . . . 221,776 204,519 157,422
Depreciation and other . . . . . . . . . . . . . . . . . . . . . . . . . . . . . . . . . . . . . . . . . . . . . . 192,161 179,027 144,632
Amortization of intangible assets . . . . . . . . . . . . . . . . . . . . . . . . . . . . . . . . . . . . . . 10,933 5,378 2,740
Total expenses . . . . . . . . . . . . . . . . . . . . . . . . . . . . . . . . . . . . . . . . . . . . . . . . . . . . . . . 2,045,633 1,920,479 1,621,032
Operating income . . . . . . . . . . . . . . . . . . . . . . . . . . . . . . . . . . . . . . . . . . . . . . . . . . . . . 260,968 279,405 223,014
Other income (expense), net:
Income (loss) from equity method investments, net (Note 6) . . . . . . . . . . . . . . . . . 19,928 (5,184)(1,591)
Interest expense, net . . . . . . . . . . . . . . . . . . . . . . . . . . . . . . . . . . . . . . . . . . . . . . . . (32,801)(15,648)(23,822)
Other, net . . . . . . . . . . . . . . . . . . . . . . . . . . . . . . . . . . . . . . . . . . . . . . . . . . . . . . . . . (5,527)(180) 256
Total other income (expense), net . . . . . . . . . . . . . . . . . . . . . . . . . . . . . . . . . . . . . . . . (18,400)(21,012)(25,157)
Income from continuing operations before income taxes . . . . . . . . . . . . . . . . . . . . . . 242,568 258,393 197,857
Income tax expense . . . . . . . . . . . . . . . . . . . . . . . . . . . . . . . . . . . . . . . . . . . . . . . . . . . (34,477)(97,941)(74,923)
Income from continuing operations . . . . . . . . . . . . . . . . . . . . . . . . . . . . . . . . . . . . . . . 208,091 160,452 122,934
Loss from discontinued operations, net of tax . . . . . . . . . . . . . . . . . . . . . . . . . . . . . . . (33,299)(10,222)(19,051)
Net income . . . . . . . . . . . . . . . . . . . . . . . . . . . . . . . . . . . . . . . . . . . . . . . . . . . . . . . . . . 174,792 150,230 103,883
Other comprehensive income (Note 15):
Foreign currency translation adjustment(2) . . . . . . . . . . . . . . . . . . . . . . . . . . . . . . . 856 1,048 (255)
Reclassification of interest rate hedges to interest expense. . . . . . . . . . . . . . . . . . . — — 896
Loss on short-term investments. . . . . . . . . . . . . . . . . . . . . . . . . . . . . . . . . . . . . . . . — — (20)
Income tax expense related to items of other comprehensive income . . . . . . . . . . — — (342)
Other comprehensive income, net of tax . . . . . . . . . . . . . . . . . . . . . . . . . . . . . . . . . . . 856 1,048 279
Comprehensive income . . . . . . . . . . . . . . . . . . . . . . . . . . . . . . . . . . . . . . . . . . . . . . . . $ 175,648 $ 151,278 $ 104,162
Basic earnings (loss) per share:
Continuing operations . . . . . . . . . . . . . . . . . . . . . . . . . . . . . . . . . . . . . . . . . . . . . . . $ 7.65 $ 5.30 $ 4.02
Discontinued operations . . . . . . . . . . . . . . . . . . . . . . . . . . . . . . . . . . . . . . . . . . . . . (1.23)(0.34)(0.62)
Basic earnings per share. . . . . . . . . . . . . . . . . . . . . . . . . . . . . . . . . . . . . . . . . . . . . . . . $ 6.42 $ 4.96 $ 3.40
Diluted earnings (loss) per share:
Continuing operations . . . . . . . . . . . . . . . . . . . . . . . . . . . . . . . . . . . . . . . . . . . . . . . $ 7.33 $ 4.99 $ 3.86
Discontinued operations . . . . . . . . . . . . . . . . . . . . . . . . . . . . . . . . . . . . . . . . . . . . . (1.17)(0.32)(0.60)
Diluted earnings per share . . . . . . . . . . . . . . . . . . . . . . . . . . . . . . . . . . . . . . . . . . . . . . $ 6.16 $ 4.67 $ 3.26
Weighted average shares used in basic per share calculations. . . . . . . . . . . . . . . . . . . 27,216 30,305 30,520
Weighted average shares used in diluted per share calculations . . . . . . . . . . . . . . . . . 28,381 32,174 31,869
(1) “Direct operating” excludes depreciation and other of $130.3 million, $127.2 million and $120.4 million for 2013,
2012, and 2011 respectively.
(2) Foreign currency translation adjustment had no tax effect in 2013, 2012, or 2011.
See accompanying Notes to Consolidated Financial Statements