Redbox 2013 Annual Report Download - page 101
Download and view the complete annual report
Please find page 101 of the 2013 Redbox annual report below. You can navigate through the pages in the report by either clicking on the pages listed below, or by using the keyword search tool below to find specific information within the annual report.-
 1
1 -
2
-
3
-
4
-
5
-
6
-
7
-
8
-
9
-
10
-
11
-
12
-
13
-
14
-
15
-
16
-
17
-
18
-
19
-
20
-
21
-
22
-
23
-
24
-
25
-
26
-
27
-
28
-
29
-
30
-
31
-
32
-
33
-
34
-
35
-
36
-
37
-
38
-
39
-
40
-
41
-
42
-
43
-
44
-
45
-
46
-
47
-
48
-
49
-
50
-
51
-
52
-
53
-
54
-
55
-
56
-
57
-
58
-
59
-
60
-
61
-
62
-
63
-
64
-
65
-
66
-
67
-
68
-
69
-
70
-
71
-
72
-
73
-
74
-
75
-
76
-
77
-
78
-
79
-
80
-
81
-
82
-
83
-
84
-
85
-
86
-
87
-
88
-
89
-
90
-
 91
91 -
 92
92 -
 93
93 -
 94
94 -
 95
95 -
 96
96 -
 97
97 -
 98
98 -
 99
99 -
 100
100 -
 101
101 -
 102
102 -
 103
103 -
 104
104 -
 105
105 -
 106
106 -
 107
107 -
 108
108 -
 109
109 -
 110
110 -
 111
111 -
112
-
113
-
114
-
115
-
116
-
117
-
118
-
119
 |
 |

92
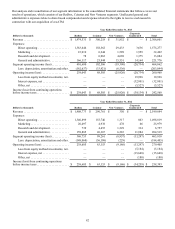
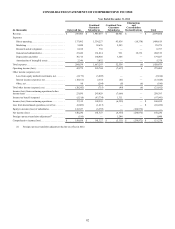
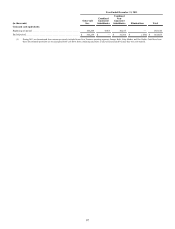
CONSOLIDATED STATEMENTS OF COMPREHENSIVE INCOME
Year Ended December 31, 2012
(in thousands) Outerwall Inc.
Combined
Guarantor
Subsidiaries
Combined Non-
Guarantor
Subsidiaries
Eliminations
and
Consolidation
Reclassifications Total
Revenue . . . . . . . . . . . . . . . . . . . . . . . . . . . . . . . . . . . . . $ 247,906 $ 1,907,037 $ 44,941 $ — $ 2,199,884
Expenses:
Direct operating. . . . . . . . . . . . . . . . . . . . . . . . . . . . 137,092 1,334,227 45,838 (18,338) 1,498,819
Marketing . . . . . . . . . . . . . . . . . . . . . . . . . . . . . . . . 5,020 18,676 2,283 — 25,979
Research and development . . . . . . . . . . . . . . . . . . . 6,018 739 — — 6,757
General and administrative . . . . . . . . . . . . . . . . . . . 23,442 161,814 931 18,332 204,519
Depreciation and other . . . . . . . . . . . . . . . . . . . . . . 30,716 144,805 3,506 — 179,027
Amortization of intangible assets . . . . . . . . . . . . . . 2,346 3,032 — — 5,378
Total expenses . . . . . . . . . . . . . . . . . . . . . . . . . . . . . . . . 204,634 1,663,293 52,558 (6) 1,920,479
Operating income (loss) . . . . . . . . . . . . . . . . . . . . . . . . 43,272 243,744 (7,617) 6 279,405
Other income (expense), net:
Loss from equity method investments, net . . . . . . . (2,179) (3,005) — — (5,184)
Interest income (expense), net. . . . . . . . . . . . . . . . . (18,161) 2,554 (41) — (15,648)
Other, net . . . . . . . . . . . . . . . . . . . . . . . . . . . . . . . . . 98 (264) (8) (6) (180)
Total other income (expense), net . . . . . . . . . . . . . . . . . (20,242) (715) (49) (6) (21,012)
Income (loss) from continuing operations before
income taxes . . . . . . . . . . . . . . . . . . . . . . . . . . . . . . . . . 23,030 243,029 (7,666) — 258,393
Income tax benefit (expense) . . . . . . . . . . . . . . . . . . . . (5,518) (93,734) 1,311 — (97,941)
Income (loss) from continuing operations. . . . . . . . . . . 17,512 149,295 (6,355) — $ 160,452
Loss from discontinued operations, net of tax . . . . . . . (8,609) (1,613) — — $ (10,222)
Equity in income (loss) of subsidiaries . . . . . . . . . . . . . 141,327 (6,355) — (134,972) —
Net income (loss). . . . . . . . . . . . . . . . . . . . . . . . . . . . . . 150,230 141,327 (6,355) (134,972) 150,230
Foreign currency translation adjustment(1) . . . . . . . . . . (196) — 1,244 — 1,048
Comprehensive income (loss) . . . . . . . . . . . . . . . . . . . . $ 150,034 $ 141,327 $ (5,111) $ (134,972) $ 151,278
(1) Foreign currency translation adjustment had no tax effect in 2012.