Redbox 2013 Annual Report Download - page 53
Download and view the complete annual report
Please find page 53 of the 2013 Redbox annual report below. You can navigate through the pages in the report by either clicking on the pages listed below, or by using the keyword search tool below to find specific information within the annual report.-
 1
1 -
2
-
3
-
4
-
5
-
6
-
7
-
8
-
9
-
10
-
11
-
12
-
13
-
14
-
15
-
16
-
17
-
18
-
19
-
20
-
21
-
22
-
23
-
24
-
25
-
26
-
27
-
28
-
29
-
30
-
31
-
32
-
33
-
34
-
35
-
36
-
37
-
38
-
39
-
40
-
41
-
42
-
 43
43 -
 44
44 -
 45
45 -
 46
46 -
 47
47 -
 48
48 -
 49
49 -
 50
50 -
 51
51 -
 52
52 -
 53
53 -
 54
54 -
 55
55 -
 56
56 -
 57
57 -
 58
58 -
 59
59 -
 60
60 -
 61
61 -
 62
62 -
 63
63 -
64
-
65
-
66
-
67
-
68
-
69
-
70
-
71
-
72
-
73
-
74
-
75
-
76
-
77
-
78
-
79
-
80
-
81
-
82
-
83
-
84
-
85
-
86
-
87
-
88
-
89
-
90
-
91
-
92
-
93
-
94
-
95
-
96
-
97
-
98
-
99
-
100
-
101
-
102
-
103
-
104
-
105
-
106
-
107
-
108
-
109
-
110
-
111
-
112
-
113
-
114
-
115
-
116
-
117
-
118
-
119
 |
 |

44
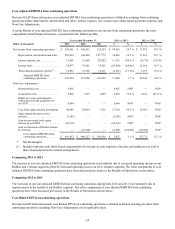
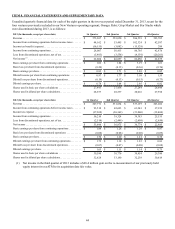
ITEM 8. FINANCIAL STATEMENTS AND SUPPLEMENTARY DATA
Unaudited quarterly financial data for each of the eight quarters in the two-year period ended December 31, 2013, recast for the
four ventures previously included in our New Ventures operating segment; Orango; Rubi; Crisp Market and Star Studio which
were discontinued during 2013, is as follows:
2013 (In thousands, except per share data) 1st Quarter 2nd Quarter 3rd Quarter 4th Quarter
Revenue . . . . . . . . . . . . . . . . . . . . . . . . . . . . . . . . . . . . . . . . . . . . $ 573,307 $ 553,050 $ 586,539 $ 593,705
Income from continuing operations before income taxes . . . . . . $ 44,162 $ 53,495 $ 102,324 $ 42,587
Income tax benefit (expense) . . . . . . . . . . . . . . . . . . . . . . . . . . . . (16,155) (3,082) (15,529) 289
Income from continuing operations . . . . . . . . . . . . . . . . . . . . . . . 28,007 50,413 86,795 42,876
Loss from discontinued operations, net of tax . . . . . . . . . . . . . . . (5,403) (3,556) (4,139) (20,201)
Net income(1) . . . . . . . . . . . . . . . . . . . . . . . . . . . . . . . . . . . . . . . . $ 22,604 $ 46,857 $ 82,656 $ 22,675
Basic earnings per share from continuing operations . . . . . . . . . $ 1.02 $ 1.84 $ 3.19 $ 1.61
Basic loss per share from discontinued operations . . . . . . . . . . . (0.20) (0.13) (0.16) (0.76)
Basic earnings per share. . . . . . . . . . . . . . . . . . . . . . . . . . . . . . . . $ 0.82 $ 1.71 $ 3.03 $ 0.85
Diluted income per share from continuing operations. . . . . . . . . $ 0.97 $ 1.77 $ 3.10 $ 1.55
Diluted loss per share from discontinued operations . . . . . . . . . . (0.19) (0.13) (0.15) (0.73)
Diluted earnings per share . . . . . . . . . . . . . . . . . . . . . . . . . . . . . . $ 0.78 $ 1.64 $ 2.95 $ 0.82
Shares used in basic per share calculations . . . . . . . . . . . . . . . . . 27,493 27,438 27,244 26,696
Shares used in diluted per share calculations. . . . . . . . . . . . . . . . 28,937 28,537 28,016 27,598
2012 (In thousands, except per share data) 1st Quarter 2nd Quarter 3rd Quarter 4th Quarter
Revenue . . . . . . . . . . . . . . . . . . . . . . . . . . . . . . . . . . . . . . . . . . . . $ 567,771 $ 531,834 $ 537,197 $ 563,082
Income from continuing operations before income taxes . . . . . . $ 93,518 $ 65,693 $ 61,243 $ 37,939
Income tax expense . . . . . . . . . . . . . . . . . . . . . . . . . . . . . . . . . . . (37,308) (26,369) (21,860) (12,404)
Income from continuing operations . . . . . . . . . . . . . . . . . . . . . . . 56,210 39,324 39,383 25,535
Loss from discontinued operations, net of tax . . . . . . . . . . . . . . . (2,514) (2,449) (2,609) (2,650)
Net income . . . . . . . . . . . . . . . . . . . . . . . . . . . . . . . . . . . . . . . . . . $ 53,696 $ 36,875 $ 36,774 $ 22,885
Basic earnings per share from continuing operations . . . . . . . . . $ 1.84 $ 1.28 $ 1.29 $ 0.87
Basic loss per share from discontinued operations . . . . . . . . . . . (0.08) (0.08) (0.08) (0.09)
Basic earnings per share. . . . . . . . . . . . . . . . . . . . . . . . . . . . . . . . $ 1.76 $ 1.20 $ 1.21 $ 0.78
Diluted earnings per share from continuing operations . . . . . . . . $ 1.72 $ 1.18 $ 1.22 $ 0.83
Diluted loss per share from discontinued operations . . . . . . . . . . (0.07) (0.07) (0.08) (0.08)
Diluted earnings per share . . . . . . . . . . . . . . . . . . . . . . . . . . . . . . $ 1.65 $ 1.11 $ 1.14 $ 0.75
Shares used in basic per share calculations . . . . . . . . . . . . . . . . . 30,590 30,776 30,454 29,380
Shares used in diluted per share calculations. . . . . . . . . . . . . . . . 32,628 33,190 32,238 30,619
(1) Net income in the third quarter of 2013 includes a $68.4 million gain on the re-measurement of our previously held
equity interest in ecoATM to its acquisition date fair value.