Redbox 2013 Annual Report Download - page 33
Download and view the complete annual report
Please find page 33 of the 2013 Redbox annual report below. You can navigate through the pages in the report by either clicking on the pages listed below, or by using the keyword search tool below to find specific information within the annual report.-
 1
1 -
2
-
3
-
4
-
5
-
6
-
7
-
8
-
9
-
10
-
11
-
12
-
13
-
14
-
15
-
16
-
17
-
18
-
19
-
20
-
21
-
22
-
 23
23 -
 24
24 -
 25
25 -
 26
26 -
 27
27 -
 28
28 -
 29
29 -
 30
30 -
 31
31 -
 32
32 -
 33
33 -
 34
34 -
 35
35 -
 36
36 -
 37
37 -
 38
38 -
 39
39 -
 40
40 -
 41
41 -
 42
42 -
 43
43 -
44
-
45
-
46
-
47
-
48
-
49
-
50
-
51
-
52
-
53
-
54
-
55
-
56
-
57
-
58
-
59
-
60
-
61
-
62
-
63
-
64
-
65
-
66
-
67
-
68
-
69
-
70
-
71
-
72
-
73
-
74
-
75
-
76
-
77
-
78
-
79
-
80
-
81
-
82
-
83
-
84
-
85
-
86
-
87
-
88
-
89
-
90
-
91
-
92
-
93
-
94
-
95
-
96
-
97
-
98
-
99
-
100
-
101
-
102
-
103
-
104
-
105
-
106
-
107
-
108
-
109
-
110
-
111
-
112
-
113
-
114
-
115
-
116
-
117
-
118
-
119
 |
 |

24
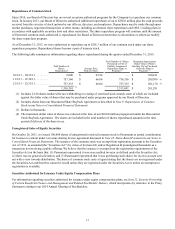
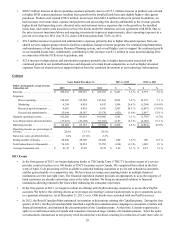
based compensation to our executives, non-employee directors, employees and related to the rights to receive cash issued in
connection with our acquisition of ecoATM are part of our shared services support function and are not allocated to our
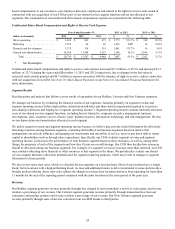
segments. The components of our unallocated share-based compensation expense are presented in the following table.
Unallocated Share-Based Compensation and Rights to Receive Cash Expense
Years Ended December 31, 2013 vs. 2012 2012 vs. 2011
Dollars in thousands 2013 2012 2011 $%$%
Direct operating. . . . . . . . . . . . . . . . . . . $ 3,636 $ 863 473 $ 2,773 321.3% $ 390 82.5%
Marketing . . . . . . . . . . . . . . . . . . . . . . . 1,559 66 50 1,493 NM* 16 32.0%
Research and development . . . . . . . . . . 1,375 334 318 1,041 311.7% 16 5.0%
General and administrative . . . . . . . . . . 14,164 11,984 9,139 2,180 18.2% 2,845 31.1%
Total . . . . . . . . . . . . . . . . . . . . . . . $ 20,734 $ 13,247 $ 9,980 $ 7,487 56.5% $ 3,267 32.7%
* Not Meaningful
Unallocated share-based compensation and rights to receive cash expense increased $7.5 million, or 56.5% and increased $3.3
million, or 32.7% during the years ended December 31, 2013 and 2012 respectively, due to changes in the fair value of
restricted stock awards granted and $8.7 million in expense associated with the issuance of rights to receive cash in connection
with our acquisition of ecoATM. See Note 10: Share-Based Payments in our Notes to Consolidated Financial Statements for
more information.
Segment Results
Our discussion and analysis that follows covers results of operations for our Redbox, Coinstar and New Ventures segments.
We manage our business by evaluating the financial results of our segments, focusing primarily on segment revenue and
segment operating income before depreciation, amortization and other and share-based compensation granted to executives,
non-employee directors and employees (“segment operating income”). Segment operating income contains internally allocated
costs of our shared services support functions, including but not limited to, corporate executive management, business
development, sales, customer service, finance, legal, human resources, information technology, and risk management. We also
review depreciation and amortization allocated to each segment.
We utilize segment revenue and segment operating income because we believe they provide useful information for effectively
allocating resources among business segments, evaluating the health of our business segments based on metrics that
management can actively influence, and gauging our investments and our ability to service, incur or pay down debt or return
capital to shareholders such as through share repurchases. Specifically, our CEO evaluates segment revenue and segment
operating income, and assesses the performance of each business segment based on these measures, as well as, among other
things, the prospects of each of the segments and how they fit into our overall strategy. Our CEO then decides how resources
should be allocated among our business segments. For example, if a segment’s revenue increases more than expected, our CEO
may consider allocating more financial or other resources to that segment in the future. We periodically evaluate our shared
services support function’s allocation methods used for segment reporting purposes, which may result in changes to segment
allocations in future periods.
We also review same store sales, which we calculate for our segments on a location basis. Most of our locations have a single
kiosk, but in locations with a high-performing kiosk, we may add additional kiosks to drive incremental revenue and provide a
broader product offering. Same store sales reflects the change in revenue from locations that have been operating for more than
13 months by the end of the reporting period compared with the same locations in the same period of the prior year.
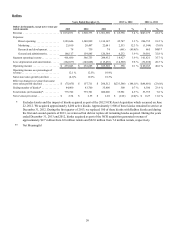
Revenue
Our Redbox segment generates revenue primarily through fees charged to rent or purchase a movie or video game, and we pay
retailers a percentage of our revenue. Our Coinstar segment generates revenue primarily through transaction fees from our
consumers and product partners and we pay retailers a percentage of our revenue. Our New Ventures segment generates
revenue primarily through sales of devices collected at our ecoATM kiosks to third parties.