Redbox 2013 Annual Report Download - page 86
Download and view the complete annual report
Please find page 86 of the 2013 Redbox annual report below. You can navigate through the pages in the report by either clicking on the pages listed below, or by using the keyword search tool below to find specific information within the annual report.-
 1
1 -
2
-
3
-
4
-
5
-
6
-
7
-
8
-
9
-
10
-
11
-
12
-
13
-
14
-
15
-
16
-
17
-
18
-
19
-
20
-
21
-
22
-
23
-
24
-
25
-
26
-
27
-
28
-
29
-
30
-
31
-
32
-
33
-
34
-
35
-
36
-
37
-
38
-
39
-
40
-
41
-
42
-
43
-
44
-
45
-
46
-
47
-
48
-
49
-
50
-
51
-
52
-
53
-
54
-
55
-
56
-
57
-
58
-
59
-
60
-
61
-
62
-
63
-
64
-
65
-
66
-
67
-
68
-
69
-
70
-
71
-
72
-
73
-
74
-
75
-
 76
76 -
 77
77 -
 78
78 -
 79
79 -
 80
80 -
 81
81 -
 82
82 -
 83
83 -
 84
84 -
 85
85 -
 86
86 -
 87
87 -
 88
88 -
 89
89 -
 90
90 -
 91
91 -
 92
92 -
 93
93 -
 94
94 -
 95
95 -
 96
96 -
97
-
98
-
99
-
100
-
101
-
102
-
103
-
104
-
105
-
106
-
107
-
108
-
109
-
110
-
111
-
112
-
113
-
114
-
115
-
116
-
117
-
118
-
119
 |
 |

77
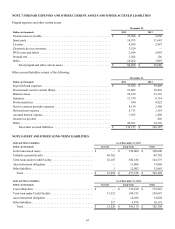
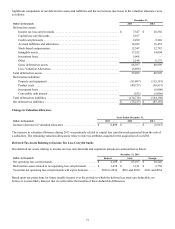
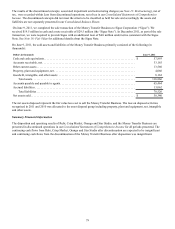
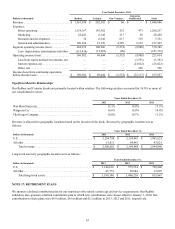
Significant components of our deferred tax assets and liabilities and the net increase (decrease) in the valuation allowance were
as follows:
Dollars in thousands
December 31,
2013 2012
Deferred tax assets:
Income tax loss carryforwards. . . . . . . . . . . . . . . . . . . . . . . . . . . . . . . . . . . . . . . . . . . . $ 7,347 $ 20,356
Capital loss carryforwards . . . . . . . . . . . . . . . . . . . . . . . . . . . . . . . . . . . . . . . . . . . . . . . 5,917 —
Credit carryforwards . . . . . . . . . . . . . . . . . . . . . . . . . . . . . . . . . . . . . . . . . . . . . . . . . . . 2,289 9,226
Accrued liabilities and allowances. . . . . . . . . . . . . . . . . . . . . . . . . . . . . . . . . . . . . . . . . 14,929 18,455
Stock-based compensation. . . . . . . . . . . . . . . . . . . . . . . . . . . . . . . . . . . . . . . . . . . . . . . 12,547 12,783
Intangible assets. . . . . . . . . . . . . . . . . . . . . . . . . . . . . . . . . . . . . . . . . . . . . . . . . . . . . . . 17,252 14,004
Investment basis. . . . . . . . . . . . . . . . . . . . . . . . . . . . . . . . . . . . . . . . . . . . . . . . . . . . . . . 3,968 —
Other . . . . . . . . . . . . . . . . . . . . . . . . . . . . . . . . . . . . . . . . . . . . . . . . . . . . . . . . . . . . . . . 2,148 6,175
Gross deferred tax assets . . . . . . . . . . . . . . . . . . . . . . . . . . . . . . . . . . . . . . . . . . . . . . . . 66,397 80,999
Less: Valuation Allowance. . . . . . . . . . . . . . . . . . . . . . . . . . . . . . . . . . . . . . . . . . . . . . . (6,898)—
Total deferred tax assets . . . . . . . . . . . . . . . . . . . . . . . . . . . . . . . . . . . . . . . . . . . . . . . . . . . . 59,499 80,999
Deferred tax liabilities:
Property and equipment . . . . . . . . . . . . . . . . . . . . . . . . . . . . . . . . . . . . . . . . . . . . . . . . . (93,407)(115,381)
Product costs . . . . . . . . . . . . . . . . . . . . . . . . . . . . . . . . . . . . . . . . . . . . . . . . . . . . . . . . . (40,757)(36,837)
Investment basis. . . . . . . . . . . . . . . . . . . . . . . . . . . . . . . . . . . . . . . . . . . . . . . . . . . . . . . — (6,906)
Convertible debt interest . . . . . . . . . . . . . . . . . . . . . . . . . . . . . . . . . . . . . . . . . . . . . . . . (552)(5,066)
Total deferred tax liabilities . . . . . . . . . . . . . . . . . . . . . . . . . . . . . . . . . . . . . . . . . . . . . . . . . (134,716)(164,190)
Net deferred tax liabilities. . . . . . . . . . . . . . . . . . . . . . . . . . . . . . . . . . . . . . . . . . . . . . . . . . .$ (75,217)$ (83,191)
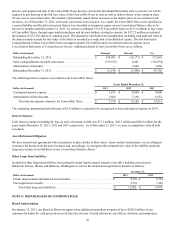
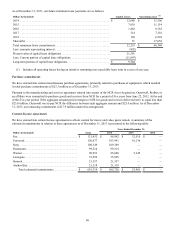
Change in Valuation Allowance
Dollars in thousands
Years Ended December 31,
2013 2012 2011
Increase (decrease) in valuation allowance . . . . . . . . . . . . . . . . . . . . . . $ 6,898 $ — $ (8,947)
The increase in valuation allowance during 2013 was primarily related to capital loss carryforwards generated from the sale of
a subsidiary. The remaining valuation allowances relate to state tax attributes acquired in the acquisition of ecoATM.
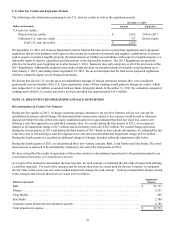
Deferred Tax Assets Relating to Income Tax Loss Carryforwards
Our deferred tax assets relating to income tax loss carryforwards and expiration periods are summarized as below:
Dollars in thousands
December 31, 2013
Federal State Foreign
Net operating loss carryforwards . . . . . . . . . . . . . . . . . . . . . . . . . . . . . . $ 4,109 $ 63,017 $ 10,540
Deferred tax assets related to net operating loss carryforwards . . . . . . . $ 1,438 $ 3,151 $ 2,758
Years that net operating loss carryforwards will expire between. . . . . . 2030 to 2034 2016 and 2030 2033 and 2034
Based upon our projections for future taxable income over the periods in which the deferred tax assets are deductible, we
believe it is more likely than not that we will realize the benefits of these deductible differences.