Redbox 2013 Annual Report Download - page 44
Download and view the complete annual report
Please find page 44 of the 2013 Redbox annual report below. You can navigate through the pages in the report by either clicking on the pages listed below, or by using the keyword search tool below to find specific information within the annual report.-
 1
1 -
2
-
3
-
4
-
5
-
6
-
7
-
8
-
9
-
10
-
11
-
12
-
13
-
14
-
15
-
16
-
17
-
18
-
19
-
20
-
21
-
22
-
23
-
24
-
25
-
26
-
27
-
28
-
29
-
30
-
31
-
32
-
33
-
 34
34 -
 35
35 -
 36
36 -
 37
37 -
 38
38 -
 39
39 -
 40
40 -
 41
41 -
 42
42 -
 43
43 -
 44
44 -
 45
45 -
 46
46 -
 47
47 -
 48
48 -
 49
49 -
 50
50 -
 51
51 -
 52
52 -
 53
53 -
 54
54 -
55
-
56
-
57
-
58
-
59
-
60
-
61
-
62
-
63
-
64
-
65
-
66
-
67
-
68
-
69
-
70
-
71
-
72
-
73
-
74
-
75
-
76
-
77
-
78
-
79
-
80
-
81
-
82
-
83
-
84
-
85
-
86
-
87
-
88
-
89
-
90
-
91
-
92
-
93
-
94
-
95
-
96
-
97
-
98
-
99
-
100
-
101
-
102
-
103
-
104
-
105
-
106
-
107
-
108
-
109
-
110
-
111
-
112
-
113
-
114
-
115
-
116
-
117
-
118
-
119
 |
 |

35
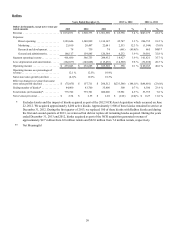
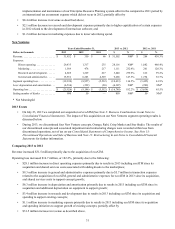
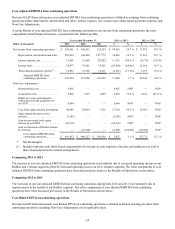
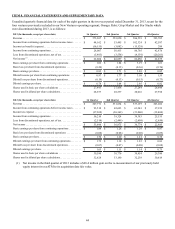
A reconciliation of core diluted EPS from continuing operation to diluted EPS from continuing operations , the most
comparable GAAP financial measure, is presented in the following table:
Years ended December 31, 2013 vs. 2012 2012 vs. 2011
2013 2012 2011 $%$%
Diluted EPS from continuing operations $ 7.33 $ 4.99 $ 3.86 $ 2.34 46.9 % $ 1.13 29.3%
Non-Core Adjustments, net of tax:(1)
Restructuring costs . . . . . . . . . . . . . 0.10 — — 0.10 NM* — NM*
Acquisition costs . . . . . . . . . . . . . . 0.17 0.06 0.03 0.11 183.3 % 0.03 100.0%
Rights to receive cash issued in
connection with the acquisition of
ecoATM . . . . . . . . . . . . . . . . . . . . . 0.25 — — 0.25 — NM*
Loss from equity method
investments. . . . . . . . . . . . . . . . . . . 1.04 0.47 0.03 0.57 121.3 % 0.44 NM*
Sigue indemnification reserve
releases . . . . . . . . . . . . . . . . . . . . . . (0.05) — — (0.05) NM* — NM*
Gain on previously held equity
interest on ecoATM . . . . . . . . . . . . (2.33) — — (2.33) NM* — NM*
Gain on formation of Redbox
Instant by Verizon. . . . . . . . . . . . . . — (0.37) — 0.37 (100.0)% (0.37) NM*
Tax benefit of worthless stock
deduction . . . . . . . . . . . . . . . . . . . . (0.59) — — (0.59) NM* — NM*
Core diluted EPS from continuing
operations . . . . . . . . . . . . . . . . . . . . . . . . $ 5.92 $ 5.15 $ 3.92 $ 0.77 15.0 % $ 1.23 31.4%
* Not Meaningful
(1) Non-Core Adjustments are presented after-tax using the applicable effective tax rate for the respective periods.
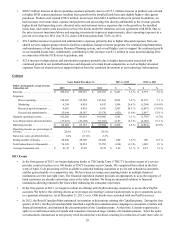
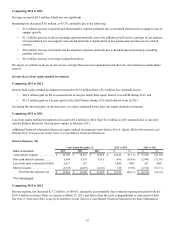
Free Cash Flow
Our non-GAAP financial measure free cash flow is defined as net cash provided by operating activities after capital
expenditures. We believe free cash flow is an important non-GAAP measure as it provides additional information to users of
the financial statements regarding our ability to service, incur or pay down indebtedness and repurchase our securities. A
reconciliation of free cash flow to net cash provided by operating activities, the most comparable GAAP financial measure, is
presented in the following table:
Years ended December 31, 2013 vs. 2012 2012 vs. 2011
Dollars in thousands 2013 2012 2011 $%$%
Net cash provided by operating
activities . . . . . . . . . . . . . . . . . . . . . . . . . $ 324,091 $ 463,906 $ 406,516 $(139,815) (30.1)% $ 57,390 14.1%
Purchase of property and equipment . . . (157,669) (208,054) (179,236) 50,385 (24.2)% (28,818) 16.1%
Free cash flow . . . . . . . . . . . . . . . . $ 166,422 $ 255,852 $ 227,280 $ (89,430) (35.0)% $ 28,572 12.6%
An analysis of our net cash from operating activities and used in investing and financing activities is provided below.
Liquidity and Capital Resources
We believe our existing cash, cash equivalents and amounts available to us under our Credit Facility will be sufficient to fund
our cash requirements and capital expenditure needs for at least the next 12 months. After that time, the extent of additional
financing needed, if any, will depend on the success of our business. If we significantly increase kiosk installations beyond
planned levels or if our Redbox, Coinstar or New Venture kiosks generate lower than anticipated revenue, then our cash needs
may increase. Furthermore, our future capital requirements will depend on a number of factors, including consumer use of our
services, the timing and number of machine installations, the number of available installable kiosks, the type and scope of
service enhancements, the cost of developing potential new product service offerings, and enhancements, cash required to fund
potential future acquisitions, investment or capital returns to shareholders such as through share repurchases. The following is
an analysis of our year-to-date cash flows: