Redbox 2013 Annual Report Download - page 81
Download and view the complete annual report
Please find page 81 of the 2013 Redbox annual report below. You can navigate through the pages in the report by either clicking on the pages listed below, or by using the keyword search tool below to find specific information within the annual report.-
 1
1 -
2
-
3
-
4
-
5
-
6
-
7
-
8
-
9
-
10
-
11
-
12
-
13
-
14
-
15
-
16
-
17
-
18
-
19
-
20
-
21
-
22
-
23
-
24
-
25
-
26
-
27
-
28
-
29
-
30
-
31
-
32
-
33
-
34
-
35
-
36
-
37
-
38
-
39
-
40
-
41
-
42
-
43
-
44
-
45
-
46
-
47
-
48
-
49
-
50
-
51
-
52
-
53
-
54
-
55
-
56
-
57
-
58
-
59
-
60
-
61
-
62
-
63
-
64
-
65
-
66
-
67
-
68
-
69
-
70
-
 71
71 -
 72
72 -
 73
73 -
 74
74 -
 75
75 -
 76
76 -
 77
77 -
 78
78 -
 79
79 -
 80
80 -
 81
81 -
 82
82 -
 83
83 -
 84
84 -
 85
85 -
 86
86 -
 87
87 -
 88
88 -
 89
89 -
 90
90 -
 91
91 -
92
-
93
-
94
-
95
-
96
-
97
-
98
-
99
-
100
-
101
-
102
-
103
-
104
-
105
-
106
-
107
-
108
-
109
-
110
-
111
-
112
-
113
-
114
-
115
-
116
-
117
-
118
-
119
 |
 |

72
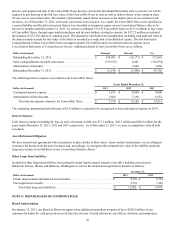
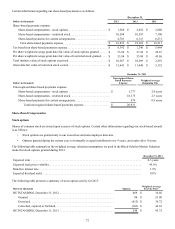
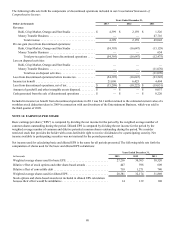
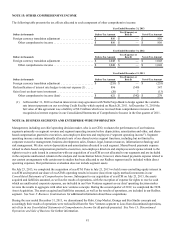
Certain information regarding our share-based payments is as follows:
December 31,
Dollars in thousands 2013 2012 2011
Share-based payments expense:
Share-based compensation - stock options . . . . . . . . . . . . . . . . . . . . . . . . . . $ 1,566 $ 2,654 $ 2,880
Share-based compensation - restricted stock . . . . . . . . . . . . . . . . . . . . . . . . . 10,504 10,593 7,100
Share-based payments for content arrangements. . . . . . . . . . . . . . . . . . . . . . 4,761 6,115 6,231
Total share-based payments expense. . . . . . . . . . . . . . . . . . . . . . . . . . . . . . $ 16,831 $ 19,362 $ 16,211
Tax benefit on share-based payments expense . . . . . . . . . . . . . . . . . . . . . . . . . . . $ 6,392 $ 7,246 $ 5,944
Per share weighted average grant date fair value of stock options granted . . . . . $ 53.90 $ 27.24 $ 20.67
Per share weighted average grant date fair value of restricted stock granted . . . . $ 53.94 $ 55.94 $ 45.86
Total intrinsic value of stock options exercised . . . . . . . . . . . . . . . . . . . . . . . . . . $ 10,567 $ 10,509 $ 2,291
Grant date fair value of restricted stock vested. . . . . . . . . . . . . . . . . . . . . . . . . . . $ 12,641 $ 11,648 $ 5,132
December 31, 2013
Dollars in thousands
Unrecognized Share-
Based Payments
Expense
Weighted-Average
Remaining Life
Unrecognized share-based payments expense:
Share-based compensation - stock options . . . . . . . . . . . . . . . . . . . . . . . . . . . . $ 1,777 2.4 years
Share-based compensation - restricted stock . . . . . . . . . . . . . . . . . . . . . . . . . . . 18,175 2.3 years
Share-based payments for content arrangements. . . . . . . . . . . . . . . . . . . . . . . . 979 0.9 years
Total unrecognized share-based payments expense . . . . . . . . . . . . . . . . . . $ 20,931
Share-Based Compensation
Stock options
Shares of common stock are issued upon exercise of stock options. Certain other information regarding our stock-based awards
is as follows:
• Stock options are granted only to our executives and non-employee directors.
• Options granted during the current year vest annually in equal installments over 4 years, and expire after 10 years.
The following table summarizes the weighted average valuation assumptions we used in the Black-Scholes-Merton Valuation
model for stock options granted during 2013:
December 31, 2013
Expected term . . . . . . . . . . . . . . . . . . . . . . . . . . . . . . . . . . . . . . . . . . . . . . . . . . . . . . . . . . . . . . . . . . . . . . . . . . . 6.3 years
Expected stock price volatility. . . . . . . . . . . . . . . . . . . . . . . . . . . . . . . . . . . . . . . . . . . . . . . . . . . . . . . . . . . . . . . 45.0%
Risk-free interest rate. . . . . . . . . . . . . . . . . . . . . . . . . . . . . . . . . . . . . . . . . . . . . . . . . . . . . . . . . . . . . . . . . . . . . . 1.9%
Expected dividend yield. . . . . . . . . . . . . . . . . . . . . . . . . . . . . . . . . . . . . . . . . . . . . . . . . . . . . . . . . . . . . . . . . . . . 0.0%
The following table presents a summary of stock option activity for 2013:
Shares in thousands Options
Weighted Average
Exercise Price
OUTSTANDING, December 31, 2012. . . . . . . . . . . . . . . . . . . . . . . . . . . . . . . . . . . . . . 669 $ 34.86
Granted . . . . . . . . . . . . . . . . . . . . . . . . . . . . . . . . . . . . . . . . . . . . . . . . . . . . . . . . . . 94 $ 53.90
Exercised . . . . . . . . . . . . . . . . . . . . . . . . . . . . . . . . . . . . . . . . . . . . . . . . . . . . . . . . . (412) $ 30.72
Cancelled, expired, or forfeited . . . . . . . . . . . . . . . . . . . . . . . . . . . . . . . . . . . . . . . . (103) $ 42.65
OUTSTANDING, December 31, 2013. . . . . . . . . . . . . . . . . . . . . . . . . . . . . . . . . . . . . . 248 $ 45.72