Redbox 2013 Annual Report Download - page 38
Download and view the complete annual report
Please find page 38 of the 2013 Redbox annual report below. You can navigate through the pages in the report by either clicking on the pages listed below, or by using the keyword search tool below to find specific information within the annual report.-
 1
1 -
2
-
3
-
4
-
5
-
6
-
7
-
8
-
9
-
10
-
11
-
12
-
13
-
14
-
15
-
16
-
17
-
18
-
19
-
20
-
21
-
22
-
23
-
24
-
25
-
26
-
27
-
 28
28 -
 29
29 -
 30
30 -
 31
31 -
 32
32 -
 33
33 -
 34
34 -
 35
35 -
 36
36 -
 37
37 -
 38
38 -
 39
39 -
 40
40 -
 41
41 -
 42
42 -
 43
43 -
 44
44 -
 45
45 -
 46
46 -
 47
47 -
 48
48 -
49
-
50
-
51
-
52
-
53
-
54
-
55
-
56
-
57
-
58
-
59
-
60
-
61
-
62
-
63
-
64
-
65
-
66
-
67
-
68
-
69
-
70
-
71
-
72
-
73
-
74
-
75
-
76
-
77
-
78
-
79
-
80
-
81
-
82
-
83
-
84
-
85
-
86
-
87
-
88
-
89
-
90
-
91
-
92
-
93
-
94
-
95
-
96
-
97
-
98
-
99
-
100
-
101
-
102
-
103
-
104
-
105
-
106
-
107
-
108
-
109
-
110
-
111
-
112
-
113
-
114
-
115
-
116
-
117
-
118
-
119
 |
 |

29
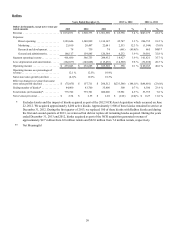
• $206.7 million increase in direct operating expenses primarily due to a $115.1 million increase in product costs related
to higher DVD content purchases resulting from growth in the installed kiosk base and slightly higher video games
purchases. Product costs totaled $796.9 million, an increase from $681.8 million in the prior period. In addition, we
had increases in revenue share expense and payment card processing fees directly attributable to the revenue growth,
higher kiosk field operating costs, allocated sales and customer service expenses due to the growth in the installed
kiosk base, and certain costs incurred to service the kiosks under the transition services agreement with NCR. Due to
the price increase mentioned above and ongoing investments in process improvements, direct operating expenses as a
percent of revenue for 2012 was 70.2%, down 240 basis points from 72.6% in 2011;
• $39.5 million increase in general and administrative expenses primarily due to higher allocated expenses from our
shared services support group related to facilities expansion, human resource programs, the continued implementation
and maintenance of our Enterprise Resource Planning system, and overall higher costs to support the continued growth
in our installed kiosks base. Additionally, contributing to this increase was $3.2 million in costs incurred during 2012
in connection with the NCR Asset Acquisition; and
• $32.6 increase in depreciation and amortization expenses primarily due to higher depreciation associated with
continued growth in our installed kiosk base and disposals of certain kiosk components, as well as higher allocated
expenses from our shared services support function from the continued investment in our technology infrastructure.
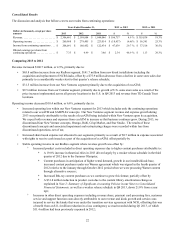
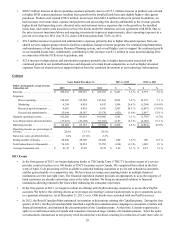
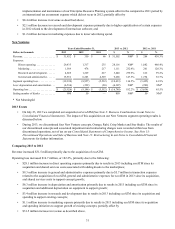
Coinstar
Years Ended December 31, 2013 vs. 2012 2012 vs. 2011
Dollars in thousands, except average
transaction size 2013 2012 2011 $%$%
Revenue . . . . . . . . . . . . . . . . . . . . . . . $ 300,218 $ 290,761 $ 282,382 $ 9,457 3.3 % $ 8,379 3.0 %
Expenses:
Direct operating. . . . . . . . . . . . . 158,562 155,740 145,362 2,822 1.8 % 10,378 7.1 %
Marketing . . . . . . . . . . . . . . . . . 6,244 4,938 6,142 1,306 26.4 % (1,204) (19.6)%
Research and development . . . . 6,962 4,455 6,542 2,507 56.3 % (2,087) (31.9)%
General and administrative . . . . 25,944 26,367 23,370 (423) (1.6)% 2,997 12.8 %
Segment operating income . . . . . . . . 102,506 99,261 100,966 3,245 3.3 % (1,705) (1.7)%
Less: Depreciation and amortization.(33,921) (36,108) (31,922) 2,187 (6.1)% (4,186) 13.1 %
Operating income . . . . . . . . . . . . . . . $ 68,585 $ 63,153 $ 69,044 $ 5,432 8.6 % $ (5,891) (8.5)%
Operating income as a percentage of
revenue . . . . . . . . . . . . . . . . . . . . . . . 22.8% 21.7 % 24.5%
Same store sales growth/(decline). . . 1.4% (0.1)% 2.1%
Ending number of kiosks. . . . . . . . . . 20,900 20,300 20,200 600 3.0 % 100 0.5 %
Total transactions (in thousands). . . . 76,120 76,954 75,552 (834) (1.1)% 1,402 1.9 %
Average transaction size . . . . . . . . . . $ 41.39 $ 39.30 38.78 $ 2.09 5.3 % $ 0.52 1.3 %
2013 Events
• In the first quarter of 2013, we began deploying kiosks to TD Canada Trust (“TDCT”) locations as part of a service
provider contract to place over 360 kiosks at TDCT locations across Canada. We completed this rollout in the first
week of April. Coin processing will be available to personal banking customers at no fee and to business customers
and the general public at a competitive rate. We have been servicing coin counting kiosks in multiple financial
institutions over the last eight years. The financial institution channel provides an opportunity to us as the majority of
bank customers are already converting coins at the teller window. We bring an automated solution to financial
institutions allowing reduced teller lines while enhancing the consumer experience.
• In the first quarter of 2013, we began to rollout an offering with PayPal allowing consumers to access their PayPal
accounts. We believe this offering allows us to leverage our existing Coinstar kiosk network to give consumers access
to e-payment alternatives. As of December 31, 2013, over 3,900 kiosks were activated with our PayPal services.
• In 2012, the Royal Canadian Mint announced its intention to discontinue minting the Canadian penny. During the first
quarter of 2013, the Royal Canadian Mint launched a significant communication campaign to consumers, retailers and
financial institutions, and instituted the discontinuation of the Canadian penny. At that time, Coinstar experienced a
spike in overall transactions in Canada and consumers transacted large volumes of Canadian pennies. Since the spike
in transactions, transactions at our grocery retail locations have declined, resulting in a reduction of same store sales in