Redbox 2013 Annual Report Download - page 75
Download and view the complete annual report
Please find page 75 of the 2013 Redbox annual report below. You can navigate through the pages in the report by either clicking on the pages listed below, or by using the keyword search tool below to find specific information within the annual report.-
 1
1 -
2
-
3
-
4
-
5
-
6
-
7
-
8
-
9
-
10
-
11
-
12
-
13
-
14
-
15
-
16
-
17
-
18
-
19
-
20
-
21
-
22
-
23
-
24
-
25
-
26
-
27
-
28
-
29
-
30
-
31
-
32
-
33
-
34
-
35
-
36
-
37
-
38
-
39
-
40
-
41
-
42
-
43
-
44
-
45
-
46
-
47
-
48
-
49
-
50
-
51
-
52
-
53
-
54
-
55
-
56
-
57
-
58
-
59
-
60
-
61
-
62
-
63
-
64
-
 65
65 -
 66
66 -
 67
67 -
 68
68 -
 69
69 -
 70
70 -
 71
71 -
 72
72 -
 73
73 -
 74
74 -
 75
75 -
 76
76 -
 77
77 -
 78
78 -
 79
79 -
 80
80 -
 81
81 -
 82
82 -
 83
83 -
 84
84 -
 85
85 -
86
-
87
-
88
-
89
-
90
-
91
-
92
-
93
-
94
-
95
-
96
-
97
-
98
-
99
-
100
-
101
-
102
-
103
-
104
-
105
-
106
-
107
-
108
-
109
-
110
-
111
-
112
-
113
-
114
-
115
-
116
-
117
-
118
-
119
 |
 |

66
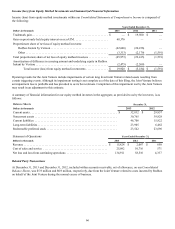
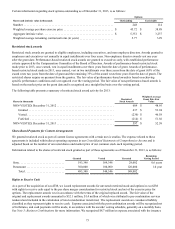
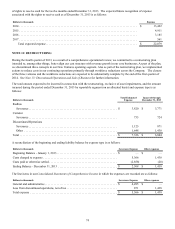
Income (loss) from Equity Method Investments and Summarized Financial Information
Income (loss) from equity method investments within our Consolidated Statements of Comprehensive Income is composed of
the following:
Years Ended December 31,
Dollars in thousands 2013 2012 2011
Trademark gain. . . . . . . . . . . . . . . . . . . . . . . . . . . . . . . . . . . . . . . . . . . . . . . . . . . . $ — $ 19,500 $ —
Gain on previously held equity interest on ecoATM . . . . . . . . . . . . . . . . . . . . . . . 68,376 — —
Proportionate share of net loss of equity method investees:
Redbox Instant by Verizon . . . . . . . . . . . . . . . . . . . . . . . . . . . . . . . . . . . . . . . (42,660)(20,236)—
Other . . . . . . . . . . . . . . . . . . . . . . . . . . . . . . . . . . . . . . . . . . . . . . . . . . . . . . . . (3,313)(2,179)(1,591)
Total proportionate share of net loss of equity method investees . . . . . . . . . . . . . (45,973)(22,415)(1,591)
Amortization of difference in carrying amount and underlying equity in Redbox
Instant by Verizon. . . . . . . . . . . . . . . . . . . . . . . . . . . . . . . . . . . . . . . . . . . . . . . . . . (2,475)(2,269)—
Total income (loss) from equity method investments . . . . . . . . . . . . . . . $ 19,928 $ (5,184)$ (1,591)
Operating results for the Joint Venture include impairments of certain long lived Joint Venture related assets resulting from
certain triggering events. Although its impairment testing is not complete as of the date of this filing, the Joint Venture believes
an impairment loss is probable and has provided to us its best estimate. Completion of this impairment test by the Joint Venture
may result in an adjustment to this estimate.
A summary of financial information for our equity method investees in the aggregate, as provided to us by the investees, is as
follows:
Balance Sheets December 31,
Dollars in thousands 2013 2012
Current assets . . . . . . . . . . . . . . . . . . . . . . . . . . . . . . . . . . . . . . . . . . . . . . . . . . . . . . . . . . . $ 32,832 $ 29,857
Noncurrent assets . . . . . . . . . . . . . . . . . . . . . . . . . . . . . . . . . . . . . . . . . . . . . . . . . . . . . . . . 30,765 39,828
Current liabilities . . . . . . . . . . . . . . . . . . . . . . . . . . . . . . . . . . . . . . . . . . . . . . . . . . . . . . . . 46,706 15,822
Long-term liabilities . . . . . . . . . . . . . . . . . . . . . . . . . . . . . . . . . . . . . . . . . . . . . . . . . . . . . . 23,905 6,462
Redeemable preferred stock . . . . . . . . . . . . . . . . . . . . . . . . . . . . . . . . . . . . . . . . . . . . . . . . 23,542 23,696
Statement of Operations Years Ended December 31,
Dollars in thousands 2013 2012 2011
Revenue . . . . . . . . . . . . . . . . . . . . . . . . . . . . . . . . . . . . . . . . . . . . . . . . . . . . . . . . . $ 15,824 $ 2,067 $ 650
Cost of sales and service . . . . . . . . . . . . . . . . . . . . . . . . . . . . . . . . . . . . . . . . . . . . 25,092 10,716 571
Net loss and loss from continuing operations . . . . . . . . . . . . . . . . . . . . . . . . . . . . 134,911 58,510 4,337
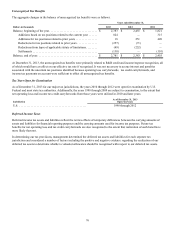
Related Party Transactions
At December 31, 2013 and December 31, 2012, included within accounts receivable, net of allowance, on our Consolidated
Balance Sheets, was $5.9 million and $0.9 million, respectively, due from the Joint Venture related to costs incurred by Redbox
on behalf of the Joint Venture during the normal course of business.