Redbox 2013 Annual Report Download - page 117
Download and view the complete annual report
Please find page 117 of the 2013 Redbox annual report below. You can navigate through the pages in the report by either clicking on the pages listed below, or by using the keyword search tool below to find specific information within the annual report.-
 1
1 -
2
-
3
-
4
-
5
-
6
-
7
-
8
-
9
-
10
-
11
-
12
-
13
-
14
-
15
-
16
-
17
-
18
-
19
-
20
-
21
-
22
-
23
-
24
-
25
-
26
-
27
-
28
-
29
-
30
-
31
-
32
-
33
-
34
-
35
-
36
-
37
-
38
-
39
-
40
-
41
-
42
-
43
-
44
-
45
-
46
-
47
-
48
-
49
-
50
-
51
-
52
-
53
-
54
-
55
-
56
-
57
-
58
-
59
-
60
-
61
-
62
-
63
-
64
-
65
-
66
-
67
-
68
-
69
-
70
-
71
-
72
-
73
-
74
-
75
-
76
-
77
-
78
-
79
-
80
-
81
-
82
-
83
-
84
-
85
-
86
-
87
-
88
-
89
-
90
-
91
-
92
-
93
-
94
-
95
-
96
-
97
-
98
-
99
-
100
-
101
-
102
-
103
-
104
-
105
-
106
-
 107
107 -
 108
108 -
 109
109 -
 110
110 -
 111
111 -
 112
112 -
 113
113 -
 114
114 -
 115
115 -
 116
116 -
 117
117 -
 118
118 -
 119
119
 |
 |
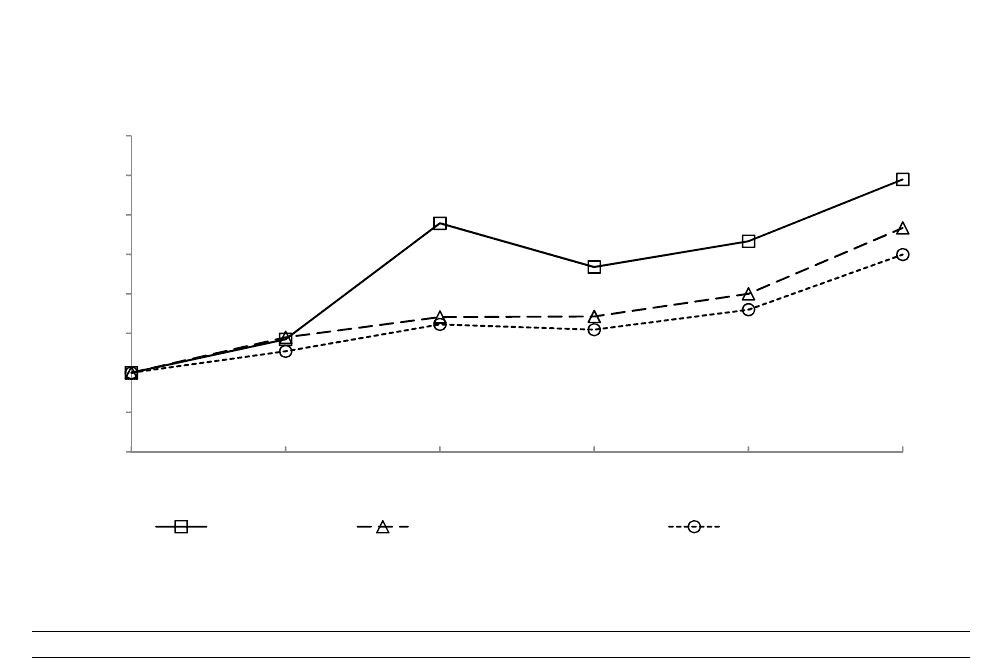
PERFORMANCE GRAPH
The following graph shows the total stockholder return of an investment of $100 on December 31, 2008 for
(i) Outerwall common stock; (ii) the NASDAQ Composite Index; and (iii) the Russell 2000 Index. All values
assume reinvestment of dividends and are plotted below as of December 31 of each fiscal year shown. The stock
price performance shown in the graph is historical and not necessarily indicative of future price performance.
12/08 12/09 12/10 12/11 12/12 12/13
Outerwall Inc. .....................................
NASDAQ Composite Index ...............
Russell 2000 Index ..............................
100.00 142.39 289.29 233.93 266.58 344.80
100.00 144.88 170.58 171.30 199.99 283.39
100.00 127.17 161.32 154.59 179.86 249.69
$0
$50
$100
$150
$200
$250
$300
$350
$400
12/08 12/09 12/10 12/11 12/12 12/13
COMPARISON OF 5 YEAR CUMULATIVE TOTAL RETURN
AMONG OUTERWALL INC., THE NASDAQ COMPOSITE INDEX,
AND THE RUSSELL 2000 INDEX
Outerwall Inc. NASDAQ Composite Index Russell 2000 Index