Quest Diagnostics 2015 Annual Report Download - page 99
Download and view the complete annual report
Please find page 99 of the 2015 Quest Diagnostics annual report below. You can navigate through the pages in the report by either clicking on the pages listed below, or by using the keyword search tool below to find specific information within the annual report.-
 1
1 -
2
-
3
-
4
-
5
-
6
-
7
-
8
-
9
-
10
-
11
-
12
-
13
-
14
-
15
-
16
-
17
-
18
-
19
-
20
-
21
-
22
-
23
-
24
-
25
-
26
-
27
-
28
-
29
-
30
-
31
-
32
-
33
-
34
-
35
-
36
-
37
-
38
-
39
-
40
-
41
-
42
-
43
-
44
-
45
-
46
-
47
-
48
-
49
-
50
-
51
-
52
-
53
-
54
-
55
-
56
-
57
-
58
-
59
-
60
-
61
-
62
-
63
-
64
-
65
-
66
-
67
-
68
-
69
-
70
-
71
-
72
-
73
-
74
-
75
-
76
-
77
-
78
-
79
-
80
-
81
-
82
-
83
-
84
-
85
-
86
-
87
-
88
-
 89
89 -
 90
90 -
 91
91 -
 92
92 -
 93
93 -
 94
94 -
 95
95 -
 96
96 -
 97
97 -
 98
98 -
 99
99 -
 100
100 -
 101
101 -
 102
102 -
 103
103 -
 104
104 -
 105
105 -
 106
106 -
 107
107 -
 108
108 -
 109
109 -
110
-
111
-
112
-
113
-
114
-
115
-
116
-
117
-
118
-
119
-
120
-
121
-
122
-
123
-
124
-
125
-
126
-
127
-
128
-
129
 |
 |

QUEST DIAGNOSTICS INCORPORATED AND SUBSIDIARIES
NOTES TO CONSOLIDATED FINANCIAL STATEMENTS – CONTINUED
(in millions unless otherwise indicated)
F- 24
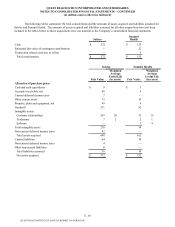
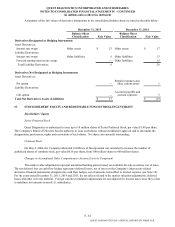
The following table provides a reconciliation of the beginning and ending balances of liabilities using significant
unobservable inputs (Level 3):
Contingent
Consideration
Call Option
Derivative
Liability Total
Balance, December 31, 2013 $ — $ 8 $ 8
Purchases, additions and issuances 26 — 26
Total (gains) losses - realized/ unrealized:
Included in earnings (9)(3)(12)
Balance, December 31, 2014 17 5 22
Settlements (1)(4)(5)
Total (gains) losses - realized/ unrealized:
Included in earnings (13)(1)(14)
Balance, December 31, 2015 $ 3 $ — $ 3
The unrealized gains and losses associated with the change in fair value of the put option derivative asset and call
option derivative liability included in earnings for the years ended December 31, 2015 and 2014 are reported in other (expense)
income, net.
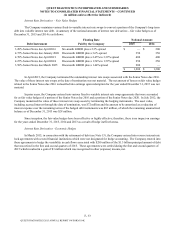
The carrying amounts of cash and cash equivalents, accounts receivable, accounts payable and accrued expenses
approximate fair value based on the short maturities of these instruments. At December 31, 2015 and 2014, the fair value of the
Company's debt was estimated at $3.7 billion and $4.2 billion, respectively. Principally all of the Company's debt is classified
within Level 1 of the fair value hierarchy because the fair value of the debt is estimated based on rates currently offered to the
Company with identical terms and maturities, using quoted active market prices and yields, taking into account the underlying
terms of the debt instruments.
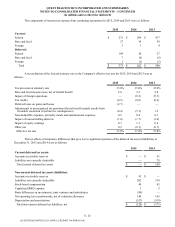
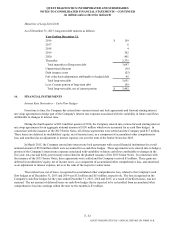
8. TAXES ON INCOME
The Company's pre-tax income from continuing operations before equity in earnings of equity method investees
consisted of $1.1 billion, $810 million and $1.3 billion from U.S. operations and $11 million, $13 million and $19 million from
foreign operations for the years ended December 31, 2015, 2014 and 2013, respectively.
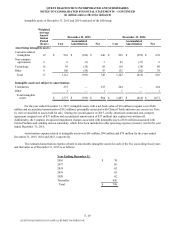
For the year ended December 31, 2015, the Company recognized $145 million deferred tax expense associated with
the financial reporting and tax basis difference resulting from the contribution of the Clinical Trials business to the Q2 Solutions
joint venture. This was partially offset by a $58 million deferred tax benefit resulting from the future tax effects of winding
down a subsidiary.
For the year ended December 31, 2013, pre-tax income from continuing operations in the U.S., income tax expense
and the effective tax rate, including the state and local income tax rate, net of federal benefit, were impacted by the gain on sale
of royalty rights. For further details regarding the sale of royalty rights, see Note 6.
QUEST DIAGNOSTICS 2015 ANNUAL REPORT ON FORM 10-K