Quest Diagnostics 2015 Annual Report Download - page 100
Download and view the complete annual report
Please find page 100 of the 2015 Quest Diagnostics annual report below. You can navigate through the pages in the report by either clicking on the pages listed below, or by using the keyword search tool below to find specific information within the annual report.-
 1
1 -
2
-
3
-
4
-
5
-
6
-
7
-
8
-
9
-
10
-
11
-
12
-
13
-
14
-
15
-
16
-
17
-
18
-
19
-
20
-
21
-
22
-
23
-
24
-
25
-
26
-
27
-
28
-
29
-
30
-
31
-
32
-
33
-
34
-
35
-
36
-
37
-
38
-
39
-
40
-
41
-
42
-
43
-
44
-
45
-
46
-
47
-
48
-
49
-
50
-
51
-
52
-
53
-
54
-
55
-
56
-
57
-
58
-
59
-
60
-
61
-
62
-
63
-
64
-
65
-
66
-
67
-
68
-
69
-
70
-
71
-
72
-
73
-
74
-
75
-
76
-
77
-
78
-
79
-
80
-
81
-
82
-
83
-
84
-
85
-
86
-
87
-
88
-
89
-
 90
90 -
 91
91 -
 92
92 -
 93
93 -
 94
94 -
 95
95 -
 96
96 -
 97
97 -
 98
98 -
 99
99 -
 100
100 -
 101
101 -
 102
102 -
 103
103 -
 104
104 -
 105
105 -
 106
106 -
 107
107 -
 108
108 -
 109
109 -
 110
110 -
111
-
112
-
113
-
114
-
115
-
116
-
117
-
118
-
119
-
120
-
121
-
122
-
123
-
124
-
125
-
126
-
127
-
128
-
129
 |
 |

QUEST DIAGNOSTICS INCORPORATED AND SUBSIDIARIES
NOTES TO CONSOLIDATED FINANCIAL STATEMENTS – CONTINUED
(in millions unless otherwise indicated)
F- 25
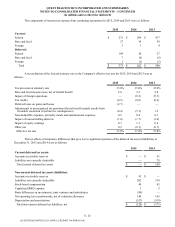
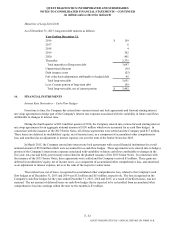
The components of income tax expense from continuing operations for 2015, 2014 and 2013 were as follows:
2015 2014 2013
Current:
Federal $ 231 $ 204 $ 417
State and local 27 34 59
Foreign 3 3 4
Deferred:
Federal 104 28 27
State and local 7 (6)(6)
Foreign 1 (1)(1)
Total $ 373 $ 262 $ 500
A reconciliation of the federal statutory rate to the Company's effective tax rate for 2015, 2014 and 2013 was as
follows:
2015 2014 2013
Tax provision at statutory rate 35.0% 35.0% 35.0%
State and local income taxes, net of federal benefit 2.6 3.2 2.8
Impact of foreign operations — (0.2)(0.3)
Tax credits (0.5)(0.8)(0.4)
Deferred taxes on gains and losses (2.7) — —
Adjustments to unrecognized tax positions (the net benefit mainly results from
favorable resolution of certain tax contingencies) (0.4)(5.1) 1.5
Non-deductible expenses, primarily meals and entertainment expenses 0.5 0.4 0.3
Impact of noncontrolling interests (1.6)(1.7)(1.0)
Impact of equity earnings 0.7 1.1 0.6
Other, net 0.2 (0.1)(0.7)
Effective tax rate 33.8% 31.8% 37.8%
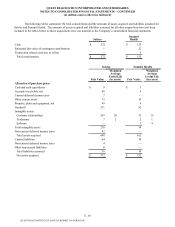
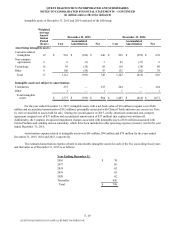
The tax effects of temporary differences that give rise to significant portions of the deferred tax assets (liabilities) at
December 31, 2015 and 2014 were as follows:
2015 2014
Current deferred tax assets:
Accounts receivable reserves $ — $ 91
Liabilities not currently deductible — 78
Total current deferred tax assets $ — $ 169
Non-current deferred tax assets (liabilities):
Accounts receivable reserves $ 95 $ —
Liabilities not currently deductible 202 138
Stock-based compensation 49 42
Capitalized R&D expense 1 3
Basis differences in investments, joint ventures and subsidiaries (90) —
Net operating loss carryforwards, net of valuation allowance 140 165
Depreciation and amortization (517)(519)
Total non-current deferred tax liabilities, net $ (120) $ (171)
QUEST DIAGNOSTICS 2015 ANNUAL REPORT ON FORM 10-K