Quest Diagnostics 2015 Annual Report Download - page 66
Download and view the complete annual report
Please find page 66 of the 2015 Quest Diagnostics annual report below. You can navigate through the pages in the report by either clicking on the pages listed below, or by using the keyword search tool below to find specific information within the annual report.-
 1
1 -
2
-
3
-
4
-
5
-
6
-
7
-
8
-
9
-
10
-
11
-
12
-
13
-
14
-
15
-
16
-
17
-
18
-
19
-
20
-
21
-
22
-
23
-
24
-
25
-
26
-
27
-
28
-
29
-
30
-
31
-
32
-
33
-
34
-
35
-
36
-
37
-
38
-
39
-
40
-
41
-
42
-
43
-
44
-
45
-
46
-
47
-
48
-
49
-
50
-
51
-
52
-
53
-
54
-
55
-
 56
56 -
 57
57 -
 58
58 -
 59
59 -
 60
60 -
 61
61 -
 62
62 -
 63
63 -
 64
64 -
 65
65 -
 66
66 -
 67
67 -
 68
68 -
 69
69 -
 70
70 -
 71
71 -
 72
72 -
 73
73 -
 74
74 -
 75
75 -
 76
76 -
77
-
78
-
79
-
80
-
81
-
82
-
83
-
84
-
85
-
86
-
87
-
88
-
89
-
90
-
91
-
92
-
93
-
94
-
95
-
96
-
97
-
98
-
99
-
100
-
101
-
102
-
103
-
104
-
105
-
106
-
107
-
108
-
109
-
110
-
111
-
112
-
113
-
114
-
115
-
116
-
117
-
118
-
119
-
120
-
121
-
122
-
123
-
124
-
125
-
126
-
127
-
128
-
129
 |
 |

62
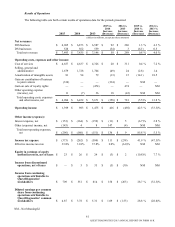
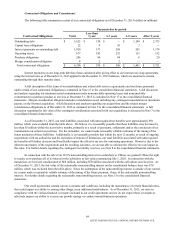
The following table sets forth certain results of continuing operations data as a percentage of net revenues for the
periods presented:
2015 2014 2013
Net revenues:
DIS business 93.0% 92.4% 92.2%
DS businesses 7.0% 7.6% 7.8%
Total net revenues 100.0% 100.0% 100.0%
Operating costs, expenses and other income:
Cost of services 62.1% 62.4% 60.5%
Selling, general and administrative 22.4 23.2 23.8
Amortization of intangible assets 1.1 1.3 1.1
Gain on contribution of business to joint venture (4.4) — —
Gain on sale of royalty rights — — (6.6)
Other operating expense (income), net 0.1 (0.1) 0.6
Total operating costs, expenses and other income, net 81.3% 86.8% 79.4%
Operating income 18.7% 13.2% 20.6%
Bad debt 4.0% 4.0% 3.8%
Continuing Operations
Results for the year ended December 31, 2015 were affected by certain items that benefited earnings per diluted share
by a net $0.48 as follows:
• a pre-tax gain of $334 million, or $1.30 per diluted share, related to the Clinical Trials Contribution;
• pre-tax charges of $150 million, or $0.62 per diluted share, related to the loss on early retirement of debt and related
refinancing charges in connection with the Tender Offer and Redemption ($6 million in interest expense, net and $144
million in other (expense) income, net);
• pre-tax charges of $105 million, or $0.44 per diluted share, related to restructuring costs primarily associated with
workforce reductions, integration costs associated with acquisitions and professional fees associated with the further
restructuring and integrating our business ($63 million in cost of services and $42 million in selling, general and
administrative expenses);
• a deferred income tax benefit of $58 million, or $0.40 per diluted share, associated with winding down a subsidiary;
• net pre-tax costs of $33 million, or $0.14 per diluted share, primarily associated with non-cash asset impairment
charges and other costs associated with Celera Products and winding down a subsidiary as well as costs incurred
related to legal matters, partially offset by a pre-tax gain of $13 million associated with a decrease in the fair value of
the contingent consideration accrual associated with our Summit Health acquisition ($2 million of costs in cost of
services, $21 million of costs in selling, general and administrative expenses and $10 million of net costs in other
operating expense (income), net); and
• pre-tax charges of $5 million, or $0.02 per diluted share, in equity in earnings of equity method investees, net of taxes
consisting of restructuring and integration charges incurred by Q2 Solutions.
Results for the year ended December 31, 2014 were affected by certain items that reduced earnings per diluted share
by a net $0.32 as follows:
• pre-tax charges of $121 million, or $0.53 per diluted share, related to restructuring costs primarily associated with
workforce reductions, integration costs associated with acquisitions and professional fees associated with the further
restructuring and integrating our business ($50 million in cost of services, $69 million in selling, general and
administrative expenses and $2 million in other operating expense (income), net);
• a discrete tax benefit of $44 million, or $0.30 per diluted share, associated with the favorable resolution of certain tax
contingencies; and
• net pre-tax costs of $15 million, or $0.09 per diluted share, primarily associated with costs related to legal matters,
partially offset by a pre-tax gain of $9 million associated with a decrease in the fair value of the contingent
QUEST DIAGNOSTICS 2015 ANNUAL REPORT ON FORM 10-K