Quest Diagnostics 2015 Annual Report Download - page 65
Download and view the complete annual report
Please find page 65 of the 2015 Quest Diagnostics annual report below. You can navigate through the pages in the report by either clicking on the pages listed below, or by using the keyword search tool below to find specific information within the annual report.-
 1
1 -
2
-
3
-
4
-
5
-
6
-
7
-
8
-
9
-
10
-
11
-
12
-
13
-
14
-
15
-
16
-
17
-
18
-
19
-
20
-
21
-
22
-
23
-
24
-
25
-
26
-
27
-
28
-
29
-
30
-
31
-
32
-
33
-
34
-
35
-
36
-
37
-
38
-
39
-
40
-
41
-
42
-
43
-
44
-
45
-
46
-
47
-
48
-
49
-
50
-
51
-
52
-
53
-
54
-
 55
55 -
 56
56 -
 57
57 -
 58
58 -
 59
59 -
 60
60 -
 61
61 -
 62
62 -
 63
63 -
 64
64 -
 65
65 -
 66
66 -
 67
67 -
 68
68 -
 69
69 -
 70
70 -
 71
71 -
 72
72 -
 73
73 -
 74
74 -
 75
75 -
76
-
77
-
78
-
79
-
80
-
81
-
82
-
83
-
84
-
85
-
86
-
87
-
88
-
89
-
90
-
91
-
92
-
93
-
94
-
95
-
96
-
97
-
98
-
99
-
100
-
101
-
102
-
103
-
104
-
105
-
106
-
107
-
108
-
109
-
110
-
111
-
112
-
113
-
114
-
115
-
116
-
117
-
118
-
119
-
120
-
121
-
122
-
123
-
124
-
125
-
126
-
127
-
128
-
129
 |
 |

61
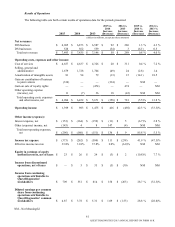
Results of Operations
The following table sets forth certain results of operations data for the periods presented:
2015 2014 2013
2015 vs.
2014
Increase
(Decrease)
2014 vs.
2013
Increase
(Decrease)
2015 vs.
2014 %
Increase
(Decrease)
2014 vs.
2013 %
Increase
(Decrease)
(dollars in millions, except per share amounts)
Net revenues:
DIS business $ 6,965 $ 6,873 $ 6,587 $ 92 $ 286 1.3 % 4.3 %
DS businesses 528 562 559 (34) 3 (6.1) 0.5
Total net revenues $ 7,493 $ 7,435 $ 7,146 $ 58 $ 289 0.8 % 4.0 %
Operating costs, expenses and other income:
Cost of services $ 4,657 $ 4,637 $ 4,326 $ 20 $ 311 0.4 % 7.2 %
Selling, general and
administrative 1,679 1,728 1,704 (49) 24 (2.8) 1.4
Amortization of intangible assets 81 94 79 (13) 15 (14.1) 18.5
Gain on contribution of business
to joint venture (334) — — (334) — NM —
Gain on sale of royalty rights — — (474) — 474 — NM
Other operating expense
(income), net 11 (7) 36 18 (43) NM NM
Total operating costs, expenses
and other income, net $ 6,094 $ 6,452 $ 5,671 $ (358) $ 781 (5.5)% 13.8 %
Operating income $ 1,399 $ 983 $ 1,475 $ 416 $ (492) 42.3 % (33.3)%
Other income (expense):
Interest expense, net $ (153) $ (164) $ (159) $ (11) $ 5 (6.7)% 2.8 %
Other (expense) income, net (143) 4 8 147 (4) NM NM
Total non-operating expenses,
net $ (296) $ (160) $ (151) $ 136 $ 9 85.8 % 5.5 %
Income tax expense $ (373) $ (262) $ (500) $ 111 $ (238) 41.9 % (47.5)%
Effective income tax rate 33.8% 31.8% 37.8% 2.0% (6.0)% NM NM
Equity in earnings of equity
method investees, net of taxes $ 23 $ 26 $ 24 $ (3) $ 2 (10.8)% 7.7 %
Income from discontinued
operations, net of taxes $ — $ 5 $ 35 $ (5) $ (30) NM NM
Income from continuing
operations attributable to
Quest Diagnostics'
stockholders $ 709 $ 551 $ 814 $ 158 $ (263) 28.7 % (32.3)%
Diluted earnings per common
share from continuing
operations attributable to
Quest Diagnostics’ common
stockholders $ 4.87 $ 3.78 $ 5.31 $ 1.09 $ (1.53) 28.8 % (28.8)%
NM - Not Meaningful
QUEST DIAGNOSTICS 2015 ANNUAL REPORT ON FORM 10-K