Quest Diagnostics 2015 Annual Report Download - page 69
Download and view the complete annual report
Please find page 69 of the 2015 Quest Diagnostics annual report below. You can navigate through the pages in the report by either clicking on the pages listed below, or by using the keyword search tool below to find specific information within the annual report.-
 1
1 -
2
-
3
-
4
-
5
-
6
-
7
-
8
-
9
-
10
-
11
-
12
-
13
-
14
-
15
-
16
-
17
-
18
-
19
-
20
-
21
-
22
-
23
-
24
-
25
-
26
-
27
-
28
-
29
-
30
-
31
-
32
-
33
-
34
-
35
-
36
-
37
-
38
-
39
-
40
-
41
-
42
-
43
-
44
-
45
-
46
-
47
-
48
-
49
-
50
-
51
-
52
-
53
-
54
-
55
-
56
-
57
-
58
-
 59
59 -
 60
60 -
 61
61 -
 62
62 -
 63
63 -
 64
64 -
 65
65 -
 66
66 -
 67
67 -
 68
68 -
 69
69 -
 70
70 -
 71
71 -
 72
72 -
 73
73 -
 74
74 -
 75
75 -
 76
76 -
 77
77 -
 78
78 -
 79
79 -
80
-
81
-
82
-
83
-
84
-
85
-
86
-
87
-
88
-
89
-
90
-
91
-
92
-
93
-
94
-
95
-
96
-
97
-
98
-
99
-
100
-
101
-
102
-
103
-
104
-
105
-
106
-
107
-
108
-
109
-
110
-
111
-
112
-
113
-
114
-
115
-
116
-
117
-
118
-
119
-
120
-
121
-
122
-
123
-
124
-
125
-
126
-
127
-
128
-
129
 |
 |

65
Interest Expense, net
Interest expense, net for the year ended December 31, 2015 decreased by $11 million compared to the prior year. The
decrease in interest expense, net was primarily a result of lower outstanding debt balances compared to the prior year and lower
interest rates associated with our 2015 Senior Notes.
Interest expense, net for the year ended December 31, 2014 increased by $5 million compared to the prior year,
primarily as a result of higher outstanding debt balances compared to the prior year.
Other (Expense) Income, net
For the years ended December 31, 2015, 2014 and 2013, other (expense) income, net includes (losses) gains of $(1)
million, $4 million and $10 million, respectively, associated with investments held in trusts pursuant to our supplemental
deferred compensation plans. In addition, other (expense) income, net for the year ended December 31, 2015, includes the loss
on early retirement of debt of $144 million associated with the Tender Offer and Redemption.
Income Tax Expense
The $111 million increase in income tax expense for the year ended December 31, 2015, compared to the prior year,
was primarily a result of deferred tax expense of $145 million associated with the gain on the Clinical Trials Contribution,
partially offset by the recognition of a $58 million deferred tax benefit associated with winding down a subsidiary as well as a
$57 million benefit associated with the loss on early retirement of debt in connection with the Tender Offer and Redemption.
The increase was further driven by a $44 million tax benefit recognized in 2014 related to the favorable resolution of a tax
contingency.
Our effective income tax rate for the year ended December 31, 2015, was negatively impacted by the higher tax rate
associated with the gain on the Clinical Trials Contribution.
The $238 million decrease in income tax expense for the year ended December 31, 2014 compared to the prior year
was primarily due to expense associated with the Ibrutinib Sale in 2013. Additionally, income tax expense and our effective
income tax rate for the year ended December 31, 2014, were positively impacted by a $44 million benefit related to the
favorable resolution of a tax contingency.
Discontinued Operations
Discontinued operations includes HemoCue, which was sold in April 2013, and NID, a test kit manufacturing
subsidiary discontinued in 2006. The results of operations for HemoCue and NID have been classified as discontinued
operations for all periods presented. For further details regarding our discontinued operations, see Note 18 to the consolidated
financial statements.
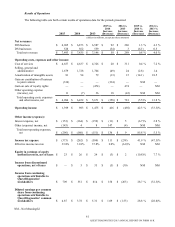
The following table summarizes our income from discontinued operations, net of taxes:
2015 vs.
2014
Increase
(Decrease)
2014 vs.
2013
Increase
(Decrease)
2015 2014 2013
(dollars in millions)
Net revenues $ — $ — $ 28 $ — $ (28)
Income from discontinued operations before taxes — 1 25 (1)(24)
Income tax benefit — (4)(10)(4)(6)
Income from discontinued operations, net of taxes $ — $ 5 $ 35 $ (5) $ (30)
Income from discontinued operations, net of taxes for the year ended December 31, 2013 includes a gain of $14
million (including foreign currency translation adjustments, partially offset by income tax expense and transaction costs)
associated with the sale of HemoCue. In addition, income from discontinued operations, net of taxes for the year ended
December 31, 2013 includes discrete tax benefits of $20 million associated with favorable resolution of certain tax
contingencies related to NID.
QUEST DIAGNOSTICS 2015 ANNUAL REPORT ON FORM 10-K