Quest Diagnostics 2015 Annual Report Download - page 45
Download and view the complete annual report
Please find page 45 of the 2015 Quest Diagnostics annual report below. You can navigate through the pages in the report by either clicking on the pages listed below, or by using the keyword search tool below to find specific information within the annual report.-
 1
1 -
2
-
3
-
4
-
5
-
6
-
7
-
8
-
9
-
10
-
11
-
12
-
13
-
14
-
15
-
16
-
17
-
18
-
19
-
20
-
21
-
22
-
23
-
24
-
25
-
26
-
27
-
28
-
29
-
30
-
31
-
32
-
33
-
34
-
 35
35 -
 36
36 -
 37
37 -
 38
38 -
 39
39 -
 40
40 -
 41
41 -
 42
42 -
 43
43 -
 44
44 -
 45
45 -
 46
46 -
 47
47 -
 48
48 -
 49
49 -
 50
50 -
 51
51 -
 52
52 -
 53
53 -
 54
54 -
 55
55 -
56
-
57
-
58
-
59
-
60
-
61
-
62
-
63
-
64
-
65
-
66
-
67
-
68
-
69
-
70
-
71
-
72
-
73
-
74
-
75
-
76
-
77
-
78
-
79
-
80
-
81
-
82
-
83
-
84
-
85
-
86
-
87
-
88
-
89
-
90
-
91
-
92
-
93
-
94
-
95
-
96
-
97
-
98
-
99
-
100
-
101
-
102
-
103
-
104
-
105
-
106
-
107
-
108
-
109
-
110
-
111
-
112
-
113
-
114
-
115
-
116
-
117
-
118
-
119
-
120
-
121
-
122
-
123
-
124
-
125
-
126
-
127
-
128
-
129
 |
 |

41
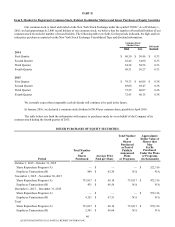
(A) Since the share repurchase program's inception in May 2003, our Board of Directors has authorized $7.0 billion of share
repurchases of our common stock through December 31, 2015. The share repurchase authority has no set expiration or
termination date.
(B) Includes: (1) shares delivered or attested to in satisfaction of the exercise price and/or tax withholding obligations by
holders of stock options (granted under the Company's Amended and Restated Employee Long-Term Incentive Plan) who
exercised options; and (2) shares withheld (under the terms of grants under the Long-Term Incentive Plan) to offset tax
withholding obligations that occur upon the delivery of outstanding common shares underlying restricted share units and
performance share units.
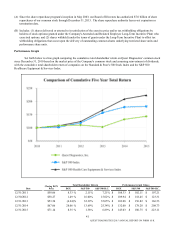
Performance Graph
Set forth below is a line graph comparing the cumulative total shareholder return on Quest Diagnostics' common stock
since December 31, 2010 based on the market price of the Company's common stock and assuming reinvestment of dividends,
with the cumulative total shareholder return of companies on the Standard & Poor's 500 Stock Index and the S&P 500
Healthcare Equipment & Services Index.
Closing DGX
Price
Total Shareholder Return Performance Graph Values
Date DGX S&P 500 S&P 500 H.C. DGX S&P 500 S&P 500 H.C.
12/31/2011 $58.06 8.33 % 2.11% 7.21% $ 108.33 $ 102.11 $ 107.21
12/30/2012 $58.27 1.49 % 16.00% 15.02% $ 109.94 $ 118.45 $ 123.31
12/31/2013 $53.54 (6.24)% 32.39% 35.05% $ 103.08 $ 156.82 $ 166.53
12/31/2014 $67.06 28.06 % 13.69% 25.34% $ 132.00 $ 178.28 $ 208.73
12/31/2015 $71.14 8.35 % 1.38% 6.89% $ 143.03 $ 180.75 $ 223.11
QUEST DIAGNOSTICS 2015 ANNUAL REPORT ON FORM 10-K