Quest Diagnostics 2015 Annual Report Download - page 80
Download and view the complete annual report
Please find page 80 of the 2015 Quest Diagnostics annual report below. You can navigate through the pages in the report by either clicking on the pages listed below, or by using the keyword search tool below to find specific information within the annual report.-
 1
1 -
2
-
3
-
4
-
5
-
6
-
7
-
8
-
9
-
10
-
11
-
12
-
13
-
14
-
15
-
16
-
17
-
18
-
19
-
20
-
21
-
22
-
23
-
24
-
25
-
26
-
27
-
28
-
29
-
30
-
31
-
32
-
33
-
34
-
35
-
36
-
37
-
38
-
39
-
40
-
41
-
42
-
43
-
44
-
45
-
46
-
47
-
48
-
49
-
50
-
51
-
52
-
53
-
54
-
55
-
56
-
57
-
58
-
59
-
60
-
61
-
62
-
63
-
64
-
65
-
66
-
67
-
68
-
69
-
 70
70 -
 71
71 -
 72
72 -
 73
73 -
 74
74 -
 75
75 -
 76
76 -
 77
77 -
 78
78 -
 79
79 -
 80
80 -
 81
81 -
 82
82 -
 83
83 -
 84
84 -
 85
85 -
 86
86 -
 87
87 -
 88
88 -
 89
89 -
 90
90 -
91
-
92
-
93
-
94
-
95
-
96
-
97
-
98
-
99
-
100
-
101
-
102
-
103
-
104
-
105
-
106
-
107
-
108
-
109
-
110
-
111
-
112
-
113
-
114
-
115
-
116
-
117
-
118
-
119
-
120
-
121
-
122
-
123
-
124
-
125
-
126
-
127
-
128
-
129
 |
 |

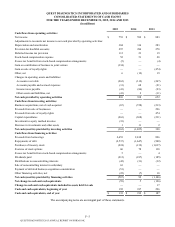
F- 5
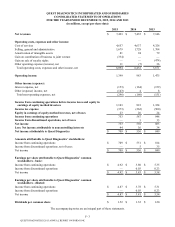
QUEST DIAGNOSTICS INCORPORATED AND SUBSIDIARIES
CONSOLIDATED STATEMENTS OF CASH FLOWS
FOR THE YEARS ENDED DECEMBER 31, 2015, 2014 AND 2013
(in millions)
2015 2014 2013
Cash flows from operating activities:
Net income $ 753 $ 592 $ 883
Adjustments to reconcile net income to net cash provided by operating activities:
Depreciation and amortization 304 314 283
Provision for doubtful accounts 297 296 270
Deferred income tax provision 112 23 19
Stock-based compensation expense 52 51 28
Excess tax benefits from stock-based compensation arrangements (5) — (4)
Gain on contribution of business to joint venture (334) — —
Gain on sale of royalty rights — — (474)
Other, net 6 (12) 19
Changes in operating assets and liabilities:
Accounts receivable (262) (312) (247)
Accounts payable and accrued expenses (31) 68 (21)
Income taxes payable (41) (84) (93)
Other assets and liabilities, net (41) 2 (11)
Net cash provided by operating activities 810 938 652
Cash flows from investing activities:
Business acquisitions, net of cash acquired (67) (728) (213)
Proceeds from sale of businesses — — 296
Proceeds from sale of royalty rights — — 474
Capital expenditures (263) (308) (231)
Investment in equity method investee (33) — —
Decrease in investments and other assets 1 11 2
Net cash (used in) provided by investing activities (362) (1,025) 328
Cash flows from financing activities:
Proceeds from borrowings 2,453 2,018 896
Repayments of debt (2,537) (1,647) (900)
Purchases of treasury stock (224) (132) (1,037)
Exercise of stock options 60 78 138
Excess tax benefits from stock-based compensation arrangements 5 — 4
Dividends paid (212) (187) (185)
Distributions to noncontrolling interests (42) (31) (32)
Sale of noncontrolling interest in subsidiary 63 — —
Payment of deferred business acquisition consideration (51) — —
Other financing activities, net (22) (7) 10
Net cash (used in) provided by financing activities (507) 92 (1,106)
Net change in cash and cash equivalents (59) 5 (126)
Change in cash and cash equivalents included in assets held for sale — — 17
Cash and cash equivalents, beginning of year 192 187 296
Cash and cash equivalents, end of year $ 133 $ 192 $ 187
The accompanying notes are an integral part of these statements.
QUEST DIAGNOSTICS 2015 ANNUAL REPORT ON FORM 10-K