Quest Diagnostics 2015 Annual Report Download - page 121
Download and view the complete annual report
Please find page 121 of the 2015 Quest Diagnostics annual report below. You can navigate through the pages in the report by either clicking on the pages listed below, or by using the keyword search tool below to find specific information within the annual report.-
 1
1 -
2
-
3
-
4
-
5
-
6
-
7
-
8
-
9
-
10
-
11
-
12
-
13
-
14
-
15
-
16
-
17
-
18
-
19
-
20
-
21
-
22
-
23
-
24
-
25
-
26
-
27
-
28
-
29
-
30
-
31
-
32
-
33
-
34
-
35
-
36
-
37
-
38
-
39
-
40
-
41
-
42
-
43
-
44
-
45
-
46
-
47
-
48
-
49
-
50
-
51
-
52
-
53
-
54
-
55
-
56
-
57
-
58
-
59
-
60
-
61
-
62
-
63
-
64
-
65
-
66
-
67
-
68
-
69
-
70
-
71
-
72
-
73
-
74
-
75
-
76
-
77
-
78
-
79
-
80
-
81
-
82
-
83
-
84
-
85
-
86
-
87
-
88
-
89
-
90
-
91
-
92
-
93
-
94
-
95
-
96
-
97
-
98
-
99
-
100
-
101
-
102
-
103
-
104
-
105
-
106
-
107
-
108
-
109
-
110
-
 111
111 -
 112
112 -
 113
113 -
 114
114 -
 115
115 -
 116
116 -
 117
117 -
 118
118 -
 119
119 -
 120
120 -
 121
121 -
 122
122 -
 123
123 -
 124
124 -
 125
125 -
 126
126 -
 127
127 -
 128
128 -
 129
129
 |
 |

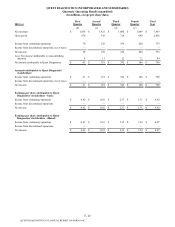
QUEST DIAGNOSTICS INCORPORATED AND SUBSIDIARIES
Quarterly Operating Results (unaudited)
(in millions, except per share data)
F- 46
2014 (a) First
Quarter Second
Quarter Third
Quarter Fourth
Quarter Total
Year
(f) (g) (h) (i)
Net revenues $ 1,746 $ 1,902 $ 1,904 $ 1,883 $ 7,435
Gross profit 645 728 726 699 2,798
Income from continuing operations 111 142 139 195 587
Income from discontinued operations, net of taxes — — — 5 5
Net income 111 142 139 200 592
Less: Net income attributable to noncontrolling
interests 7 9 10 10 36
Net income attributable to Quest Diagnostics $ 104 $ 133 $ 129 $ 190 $ 556
Amounts attributable to Quest Diagnostics'
stockholders:
Income from continuing operations $ 104 $ 133 $ 129 $ 185 $ 551
Income from discontinued operations, net of taxes — — — 5 5
Net income $ 104 $ 133 $ 129 $ 190 $ 556
Earnings per share attributable to Quest
Diagnostics' stockholders - basic:
Income from continuing operations $ 0.72 $ 0.92 $ 0.89 $ 1.27 $ 3.80
Income from discontinued operations — — — 0.03 0.03
Net income $ 0.72 $ 0.92 $ 0.89 $ 1.30 $ 3.83
Earnings per share attributable to Quest
Diagnostics' stockholders - diluted:
Income from continuing operations $ 0.71 $ 0.92 $ 0.88 $ 1.26 $ 3.78
Income from discontinued operations — — — 0.03 0.03
Net income $ 0.71 $ 0.92 $ 0.88 $ 1.29 $ 3.81
(a) In April 2013, the Company completed the sale of HemoCue. During the third quarter of 2006, the Company completed its
wind down of NID and classified the operations of NID as discontinued operations. Results of operations have been
prepared to report the results of HemoCue and NID as discontinued operations for all periods presented (see Note 18). In
July 2015, the Company contributed its clinical trials testing business to a newly formed global clinical trials central
laboratory services joint venture, Q2 Solutions. Subsequent to closing, the Company's ownership interest in the joint
venture is being accounted for under the equity method of accounting.
(b) Includes pre-tax charges of $31 million, primarily associated with workforce reductions and professional fees incurred in
connection with further restructuring and integrating the Company ($20 million in cost of services and $11 million in
selling, general and administrative expenses); pre-tax charges of $8 million in other operating expense (income), net,
representing non-cash asset impairment charges associated with our Celera Products business; pre-tax charges in selling,
general and administrative expenses of $2 million, principally representing costs incurred related to legal matters; and pre-
tax charges of $79 million on retirement of debt associated with the March 2015 cash tender offer in other (expense)
income, net (see Note 13).
(c) Includes pre-tax charges of $23 million, primarily associated with workforce reductions and professional fees incurred in
connection with further restructuring and integrating the Company ($11 million in cost of services and $12 million in
selling, general and administrative expenses); a pre-tax gain included in other operating expense (income), net of $13
million associated with a decrease in the fair value of the contingent consideration accrual associated with our Summit
Health acquisition (see Note 5 and Note 7); pre-tax charges in selling, general and administrative expenses of $5 million,
principally representing costs incurred related to legal matters; pre-tax charges of $5 million in other operating expense
QUEST DIAGNOSTICS 2015 ANNUAL REPORT ON FORM 10-K