Quest Diagnostics 2015 Annual Report Download - page 68
Download and view the complete annual report
Please find page 68 of the 2015 Quest Diagnostics annual report below. You can navigate through the pages in the report by either clicking on the pages listed below, or by using the keyword search tool below to find specific information within the annual report.-
 1
1 -
2
-
3
-
4
-
5
-
6
-
7
-
8
-
9
-
10
-
11
-
12
-
13
-
14
-
15
-
16
-
17
-
18
-
19
-
20
-
21
-
22
-
23
-
24
-
25
-
26
-
27
-
28
-
29
-
30
-
31
-
32
-
33
-
34
-
35
-
36
-
37
-
38
-
39
-
40
-
41
-
42
-
43
-
44
-
45
-
46
-
47
-
48
-
49
-
50
-
51
-
52
-
53
-
54
-
55
-
56
-
57
-
 58
58 -
 59
59 -
 60
60 -
 61
61 -
 62
62 -
 63
63 -
 64
64 -
 65
65 -
 66
66 -
 67
67 -
 68
68 -
 69
69 -
 70
70 -
 71
71 -
 72
72 -
 73
73 -
 74
74 -
 75
75 -
 76
76 -
 77
77 -
 78
78 -
79
-
80
-
81
-
82
-
83
-
84
-
85
-
86
-
87
-
88
-
89
-
90
-
91
-
92
-
93
-
94
-
95
-
96
-
97
-
98
-
99
-
100
-
101
-
102
-
103
-
104
-
105
-
106
-
107
-
108
-
109
-
110
-
111
-
112
-
113
-
114
-
115
-
116
-
117
-
118
-
119
-
120
-
121
-
122
-
123
-
124
-
125
-
126
-
127
-
128
-
129
 |
 |
64
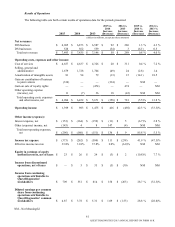
Cost of services increased $311 million for the year ended December 31, 2014, as compared to the year ended
December 31, 2013. This increase was primarily driven by additional operating costs associated with our acquisitions and
higher performance-based compensation costs. These increases were partially offset by cost reductions under the Invigorate
program and lower restructuring and integration costs compared to the prior year. In addition, cost of services includes a $56
million increase in the current year, that was principally due to the allocation of certain facility costs between cost of services
and selling, general and administrative expenses for those facilities that support both service delivery and administrative
functions, in order to reflect our current operations.
Selling, General and Administrative Expenses ("SG&A")
SG&A consist principally of the costs associated with our sales and marketing efforts, billing operations, bad debt
expense and general management and administrative support as well as administrative facility costs.
SG&A decreased $49 million for the year ended December 31, 2015 compared to the prior year. The decrease in
SG&A was primarily driven by lower compensation and benefits as a result of cost reductions under the Invigorate program,
lower restructuring and integration charges and the impact of our disposition (the Clinical Trials Contribution) on operating
costs, partially offset by additional operating costs associated with our acquisitions.
SG&A increased $24 million for the year ended December 31, 2014 compared to the prior year. This increase was due
to additional operating costs associated with our acquisitions, higher performance-based compensation costs, costs related to
legal matters and higher bad debt expense. This increase was partially offset by a $56 million reduction to SG&A, that was
principally due to the allocation of certain facility costs between cost of services and SG&A for those facilities that support
both service delivery and administrative functions, in order to reflect our current operations. In addition, this increase was also
partially offset by lower overall compensation and benefit costs, resulting from reduced headcount under the Invigorate
program, and lower restructuring and integration related costs compared to the prior year.
Amortization of Intangible Assets
The $13 million decrease in amortization of intangible assets for the year ended December 31, 2015 compared to the
prior year was primarily a result of intangible assets that became fully amortized in 2014 and early 2015.
The $15 million increase in amortization of intangible assets for the year ended December 31, 2014 compared to the
prior year primarily reflects the impact of amortization of intangible assets acquired as part of our Solstas Lab Partners Group
("Solstas"), Summit Health, Inc. ("Summit Health") and Steward Health Care Systems, LLC outreach laboratory service
("Steward") acquisitions.
Gain on Contribution of Business to Joint Venture
Gain on contribution of business to joint venture for the year ended December 31, 2015 is the non-cash gain resulting
from the Clinical Trials Contribution.
Gain on Sale of Royalty Rights
For the year ended December 31, 2013, gain on sale of royalty rights includes the gain associated with the Ibrutinib
Sale.
Other Operating Expense (Income), net
Other operating expense (income), net includes miscellaneous income and expense items and other charges related to
operating activities.
For the year ended December 31, 2015, other operating expense (income), net includes non-cash asset impairment
charges primarily associated with our Celera Products business and another subsidiary, partially offset by a gain of $13 million
associated with a decrease in the fair value of the contingent consideration accrual associated with our Summit Health
acquisition. For the year ended December 31, 2014, other operating expense (income), net includes a gain of $9 million
associated with a decrease in the fair value of the contingent consideration accrual associated with our Summit Health
acquisition. For the year ended December 31, 2013 other operating expense (income), net includes the loss on sale of Enterix
of $40 million.
QUEST DIAGNOSTICS 2015 ANNUAL REPORT ON FORM 10-K