Quest Diagnostics 2015 Annual Report Download - page 78
Download and view the complete annual report
Please find page 78 of the 2015 Quest Diagnostics annual report below. You can navigate through the pages in the report by either clicking on the pages listed below, or by using the keyword search tool below to find specific information within the annual report.-
 1
1 -
2
-
3
-
4
-
5
-
6
-
7
-
8
-
9
-
10
-
11
-
12
-
13
-
14
-
15
-
16
-
17
-
18
-
19
-
20
-
21
-
22
-
23
-
24
-
25
-
26
-
27
-
28
-
29
-
30
-
31
-
32
-
33
-
34
-
35
-
36
-
37
-
38
-
39
-
40
-
41
-
42
-
43
-
44
-
45
-
46
-
47
-
48
-
49
-
50
-
51
-
52
-
53
-
54
-
55
-
56
-
57
-
58
-
59
-
60
-
61
-
62
-
63
-
64
-
65
-
66
-
67
-
 68
68 -
 69
69 -
 70
70 -
 71
71 -
 72
72 -
 73
73 -
 74
74 -
 75
75 -
 76
76 -
 77
77 -
 78
78 -
 79
79 -
 80
80 -
 81
81 -
 82
82 -
 83
83 -
 84
84 -
 85
85 -
 86
86 -
 87
87 -
 88
88 -
89
-
90
-
91
-
92
-
93
-
94
-
95
-
96
-
97
-
98
-
99
-
100
-
101
-
102
-
103
-
104
-
105
-
106
-
107
-
108
-
109
-
110
-
111
-
112
-
113
-
114
-
115
-
116
-
117
-
118
-
119
-
120
-
121
-
122
-
123
-
124
-
125
-
126
-
127
-
128
-
129
 |
 |

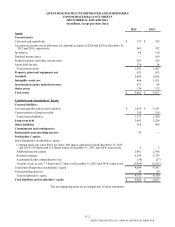
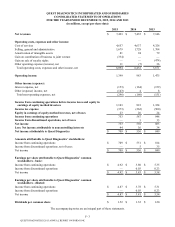
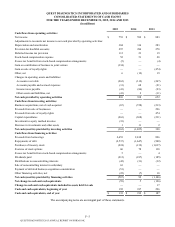
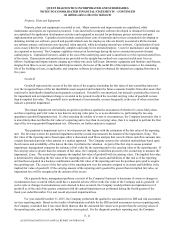
F- 3
QUEST DIAGNOSTICS INCORPORATED AND SUBSIDIARIES
CONSOLIDATED STATEMENTS OF OPERATIONS
FOR THE YEARS ENDED DECEMBER 31, 2015, 2014 AND 2013
(in millions, except per share data)
2015 2014 2013
Net revenues $ 7,493 $ 7,435 $ 7,146
Operating costs, expenses and other income:
Cost of services 4,657 4,637 4,326
Selling, general and administrative 1,679 1,728 1,704
Amortization of intangible assets 81 94 79
Gain on contribution of business to joint venture (334) — —
Gain on sale of royalty rights — — (474)
Other operating expense (income), net 11 (7) 36
Total operating costs, expenses and other income, net 6,094 6,452 5,671
Operating income 1,399 983 1,475
Other income (expense):
Interest expense, net (153)(164)(159)
Other (expense) income, net (143) 4 8
Total non-operating expenses, net (296)(160)(151)
Income from continuing operations before income taxes and equity in
earnings of equity method investees 1,103 823 1,324
Income tax expense (373)(262)(500)
Equity in earnings of equity method investees, net of taxes 23 26 24
Income from continuing operations 753 587 848
Income from discontinued operations, net of taxes — 5 35
Net income 753 592 883
Less: Net income attributable to noncontrolling interests 44 36 34
Net income attributable to Quest Diagnostics $ 709 $ 556 $ 849
Amounts attributable to Quest Diagnostics’ stockholders:
Income from continuing operations $ 709 $ 551 $ 814
Income from discontinued operations, net of taxes — 5 35
Net income $ 709 $ 556 $ 849
Earnings per share attributable to Quest Diagnostics’ common
stockholders - basic:
Income from continuing operations $ 4.92 $ 3.80 $ 5.35
Income from discontinued operations — 0.03 0.23
Net income $ 4.92 $ 3.83 $ 5.58
Earnings per share attributable to Quest Diagnostics’ common
stockholders - diluted:
Income from continuing operations $ 4.87 $ 3.78 $ 5.31
Income from discontinued operations — 0.03 0.23
Net income $ 4.87 $ 3.81 $ 5.54
Dividends per common share $ 1.52 $ 1.32 $ 1.20
The accompanying notes are an integral part of these statements.
QUEST DIAGNOSTICS 2015 ANNUAL REPORT ON FORM 10-K