Quest Diagnostics 2015 Annual Report Download - page 9
Download and view the complete annual report
Please find page 9 of the 2015 Quest Diagnostics annual report below. You can navigate through the pages in the report by either clicking on the pages listed below, or by using the keyword search tool below to find specific information within the annual report.-
 1
1 -
 2
2 -
 3
3 -
 4
4 -
 5
5 -
 6
6 -
 7
7 -
 8
8 -
 9
9 -
 10
10 -
 11
11 -
 12
12 -
 13
13 -
 14
14 -
 15
15 -
 16
16 -
 17
17 -
 18
18 -
 19
19 -
 20
20 -
21
-
22
-
23
-
24
-
25
-
26
-
27
-
28
-
29
-
30
-
31
-
32
-
33
-
34
-
35
-
36
-
37
-
38
-
39
-
40
-
41
-
42
-
43
-
44
-
45
-
46
-
47
-
48
-
49
-
50
-
51
-
52
-
53
-
54
-
55
-
56
-
57
-
58
-
59
-
60
-
61
-
62
-
63
-
64
-
65
-
66
-
67
-
68
-
69
-
70
-
71
-
72
-
73
-
74
-
75
-
76
-
77
-
78
-
79
-
80
-
81
-
82
-
83
-
84
-
85
-
86
-
87
-
88
-
89
-
90
-
91
-
92
-
93
-
94
-
95
-
96
-
97
-
98
-
99
-
100
-
101
-
102
-
103
-
104
-
105
-
106
-
107
-
108
-
109
-
110
-
111
-
112
-
113
-
114
-
115
-
116
-
117
-
118
-
119
-
120
-
121
-
122
-
123
-
124
-
125
-
126
-
127
-
128
-
129
 |
 |

5
Our disciplined capital deployment framework includes dividends, share repurchases and investment in our business
and is intended to improve ROIC. The framework is grounded in maintaining an investment grade credit rating. We expect to
return a majority of our free cash flow to investors through a combination of dividends and share repurchases. In 2015, we
returned 80% of our free cash flow to investors.
Consistent with that expectation, in January 2016 we announced that we increased our quarterly common stock
dividend by 5%, from $0.38 per common share to $0.40 per common share. This represents our fifth increase in the dividend
since 2011. We also believe that opportunities may arise to return incremental capital to shareholders from free cash flow as a
result of portfolio actions. In December 2015, we announced a $500 million increase in repurchase authority under our
common stock repurchase program. Since the beginning of 2012, we have returned more than $1.5 billion to stockholders
through repurchases of our common stock.
We will continue to invest in our business in a disciplined manner. We have established a solid foundation of strategic
assets and capabilities. We expect to generate 1 to 2 percent revenue growth per year through value-creating, strategically-
aligned acquisitions using disciplined investment criteria. We screen potential acquisitions using guidelines that assess
strategic fit and financial considerations, including value creation, ROIC and impact on our earnings.
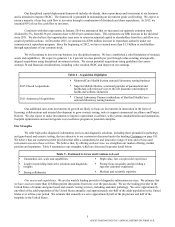
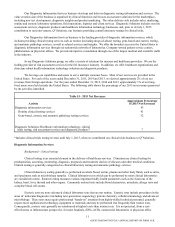
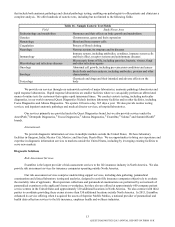
Table 8 - Acquisition Highlights
2015 Closed Acquisitions
MemorialCare Health System outreach laboratory testing business
Superior Mobile Medics, a national provider of paramedical and
health data collection services to the life insurance and employer
health and wellness industries
2015 Announced Acquisitions Clinical Laboratory Partners (subsidiary of Hartford HealthCare)
outreach laboratory testing business
Our additional near-term investments in growth are likely to focus on investments in innovation in the form of
licensing, collaborations and internal development to grow esoteric testing, tools to support commercial excellence and Project
Restore. We also expect to make investments to improve operational excellence, with systems standardization and automation,
footprint optimization and our Invigorate cost excellence program as potential examples.
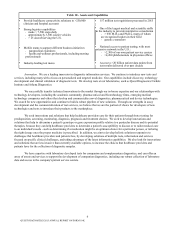
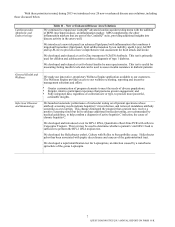
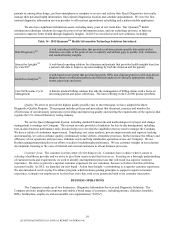
Our Strengths
We offer high value diagnostic information services and diagnostic solutions, including those grounded in pathology
and gene-based and esoteric testing, that are attractive to our customers (discussed under the heading Customers on page 18).
We believe that our customers prefer providers that offer a comprehensive and innovative range of tests and services and
convenient access to those services. We believe that, by offering such services, we strengthen our market offering, market
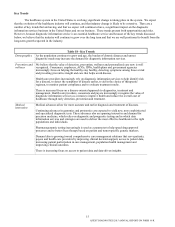
position and reputation. Table 9 summarizes our strengths, which are discussed in greater detail below.
Table 9 - Positioned to Grow and Continue to Lead
Unmatched size, scale and capabilities High value, low cost provider experience
Leader in providing innovative solutions and diagnostic
insights
Strong focus on quality and providing a
superior customer experience
Strong collaborator Medical and scientific expertise
Our assets and capabilities. We are the world's leading provider of diagnostic information services. We estimate that
we have access to more than 20 billion patient data points from tests over the past decade. We are the leading provider in the
United States of routine and gene-based and esoteric testing services, including anatomic pathology. We serve approximately
one-third of the adult population of the United States annually, and approximately one-half of the adult population in the United
States over a three-year period. We estimate that annually we serve approximately half of the physicians and half of the
hospitals in the United States.
QUEST DIAGNOSTICS 2015 ANNUAL REPORT ON FORM 10-K