Quest Diagnostics 2015 Annual Report Download - page 44
Download and view the complete annual report
Please find page 44 of the 2015 Quest Diagnostics annual report below. You can navigate through the pages in the report by either clicking on the pages listed below, or by using the keyword search tool below to find specific information within the annual report.-
 1
1 -
2
-
3
-
4
-
5
-
6
-
7
-
8
-
9
-
10
-
11
-
12
-
13
-
14
-
15
-
16
-
17
-
18
-
19
-
20
-
21
-
22
-
23
-
24
-
25
-
26
-
27
-
28
-
29
-
30
-
31
-
32
-
33
-
 34
34 -
 35
35 -
 36
36 -
 37
37 -
 38
38 -
 39
39 -
 40
40 -
 41
41 -
 42
42 -
 43
43 -
 44
44 -
 45
45 -
 46
46 -
 47
47 -
 48
48 -
 49
49 -
 50
50 -
 51
51 -
 52
52 -
 53
53 -
 54
54 -
55
-
56
-
57
-
58
-
59
-
60
-
61
-
62
-
63
-
64
-
65
-
66
-
67
-
68
-
69
-
70
-
71
-
72
-
73
-
74
-
75
-
76
-
77
-
78
-
79
-
80
-
81
-
82
-
83
-
84
-
85
-
86
-
87
-
88
-
89
-
90
-
91
-
92
-
93
-
94
-
95
-
96
-
97
-
98
-
99
-
100
-
101
-
102
-
103
-
104
-
105
-
106
-
107
-
108
-
109
-
110
-
111
-
112
-
113
-
114
-
115
-
116
-
117
-
118
-
119
-
120
-
121
-
122
-
123
-
124
-
125
-
126
-
127
-
128
-
129
 |
 |

40
PART II
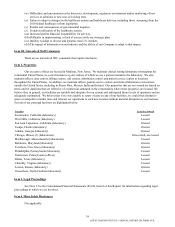
Item 5. Market for Registrant's Common Stock, Related Stockholder Matters and Issuer Purchases of Equity Securities
Our common stock is listed and traded on the New York Stock Exchange under the symbol “DGX.” As of February 1,
2016, we had approximately 2,800 record holders of our common stock; we believe that the number of beneficial holders of our
common stock exceeds the number of record holders. The following table sets forth, for the periods indicated, the high and low
sales price per share as reported on the New York Stock Exchange Consolidated Tape and dividend information.
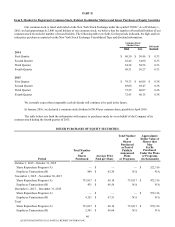
Common Stock
Market Price Dividends
Declared
High Low
2014
First Quarter $ 60.50 $ 50.46 $ 0.33
Second Quarter 62.42 54.90 0.33
Third Quarter 64.38 58.56 0.33
Fourth Quarter 68.51 56.27 0.33
2015
First Quarter $ 78.33 $ 66.09 $ 0.38
Second Quarter 89.00 69.47 0.38
Third Quarter 75.25 60.07 0.38
Fourth Quarter 72.43 60.15 0.38
We currently expect that comparable cash dividends will continue to be paid in the future.
In January 2016, we declared a common stock dividend of $0.40 per common share, payable in April 2016.
The table below sets forth the information with respect to purchases made by or on behalf of the Company of its
common stock during the fourth quarter of 2015.
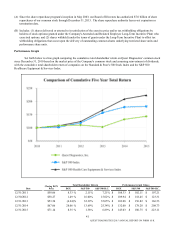
ISSUER PURCHASES OF EQUITY SECURITIES
Period
Total Number
of
Shares
Purchased Average Price
Paid per Share
Total Number
of
Shares
Purchased
as Part of
Publicly
Announced
Plans
or Programs
Approximate
Dollar Value of
Shares that
May
Yet Be
Purchased
Under the Plans
or Programs
(in thousands)
October 1, 2015 – October 31, 2015
Share Repurchase Program (A) — $ — — $ 522,116
Employee Transactions (B) 809 $ 62.24 N/A N/A
November 1, 2015 – November 30, 2015
Share Repurchase Program (A) 733,817 $ 68.14 733,817 $ 472,116
Employee Transactions (B) 431 $ 66.56 N/A N/A
December 1, 2015 – December 31, 2015
Share Repurchase Program (A) — $ — — $ 972,116
Employee Transactions (B) 4,121 $ 67.51 N/A N/A
Total
Share Repurchase Program (A) 733,817 $ 68.14 733,817 $ 972,116
Employee Transactions (B) 5,361 $ 66.64 N/A N/A
QUEST DIAGNOSTICS 2015 ANNUAL REPORT ON FORM 10-K