Quest Diagnostics 2015 Annual Report Download - page 67
Download and view the complete annual report
Please find page 67 of the 2015 Quest Diagnostics annual report below. You can navigate through the pages in the report by either clicking on the pages listed below, or by using the keyword search tool below to find specific information within the annual report.-
 1
1 -
2
-
3
-
4
-
5
-
6
-
7
-
8
-
9
-
10
-
11
-
12
-
13
-
14
-
15
-
16
-
17
-
18
-
19
-
20
-
21
-
22
-
23
-
24
-
25
-
26
-
27
-
28
-
29
-
30
-
31
-
32
-
33
-
34
-
35
-
36
-
37
-
38
-
39
-
40
-
41
-
42
-
43
-
44
-
45
-
46
-
47
-
48
-
49
-
50
-
51
-
52
-
53
-
54
-
55
-
56
-
 57
57 -
 58
58 -
 59
59 -
 60
60 -
 61
61 -
 62
62 -
 63
63 -
 64
64 -
 65
65 -
 66
66 -
 67
67 -
 68
68 -
 69
69 -
 70
70 -
 71
71 -
 72
72 -
 73
73 -
 74
74 -
 75
75 -
 76
76 -
 77
77 -
78
-
79
-
80
-
81
-
82
-
83
-
84
-
85
-
86
-
87
-
88
-
89
-
90
-
91
-
92
-
93
-
94
-
95
-
96
-
97
-
98
-
99
-
100
-
101
-
102
-
103
-
104
-
105
-
106
-
107
-
108
-
109
-
110
-
111
-
112
-
113
-
114
-
115
-
116
-
117
-
118
-
119
-
120
-
121
-
122
-
123
-
124
-
125
-
126
-
127
-
128
-
129
 |
 |
63
consideration accrual associated with our Summit Health acquisition ($24 million of costs in selling, general and
administrative expenses and a pre-tax gain of $9 million in other operating expense (income), net).
Results for the year ended December 31, 2013 were affected by certain items that benefited earnings per diluted share
by a net $1.31 as follows:
• a pre-tax gain of $474 million, or $1.95 per diluted share, associated with the sale of future royalty rights of ibrutinib
("Ibrutinib Sale");
• pre-tax charges of $115 million, or $0.47 per diluted share, related to restructuring costs primarily associated with
workforce reductions, integration costs and professional fees associated with further restructuring and integrating our
business ($43 million in cost of services and $72 million in selling, general and administrative expenses); and
• a pre-tax loss of $40 million, or $0.17 per diluted share, in other operating expense (income), net associated with the
sale of Enterix.
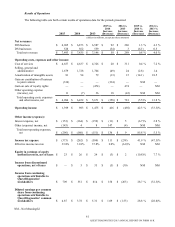
Net Revenues
Net revenues for the year ended December 31, 2015 were 0.8% above the prior year level. The Clinical Trials
Contribution negatively impacted net revenues by 1.2%.
DIS revenues increased by 1.3% for the year ended December 31, 2015 compared to the prior year. Acquisitions
contributed nearly 1.3% to DIS revenue growth. DIS volume, measured by the number of requisitions, increased 1.2% for the
year ended December 31, 2015 compared to the prior year. Acquisitions contributed approximately 1.5% to DIS volume in the
period. Revenue per requisition for the year ended December 31, 2015 increased 0.1% compared to the prior year, reflecting
growth in gene-based and esoteric testing as well as strong growth in wellness and prescription drug monitoring, substantially
offset by moderate reimbursement pressure.
For the year ended December 31, 2015, combined revenues in our DS businesses decreased by 6.1% compared to the
prior year. The Clinical Trials Contribution negatively impacted DS revenues by approximately 17%.
Net revenues for the year ended December 31, 2014 were 4.0% above the prior year level.
DIS revenues increased by 4.3% for the year ended December 31, 2014 compared to the prior year. Acquisitions
contributed approximately 6% to DIS revenue growth. In addition, six new professional lab services agreements executed in
late 2013 and 2014 contributed to DIS revenue growth. These benefits were partially offset by our decision to not renew
certain business due to strategic reasons during the year. DIS volume, measured by the number of requisitions, increased 6.3%
for the year end December 31, 2014 compared to the prior year. Acquisitions contributed approximately 7% to the DIS volume
for the year ended December 31, 2014. Organic volume decreased approximately 1% primarily due to the harsh winter and our
decision to not renew certain business due to strategic reasons during the year. Revenue per requisition for the year ended
December 31, 2014 decreased 1.8% compared to the prior year. Acquisitions reduced revenue per requisition by approximately
1% during the year as a result of test mix associated with those acquisitions.
For the year ended December 31, 2014, combined revenues in our DS businesses increased by 0.5% compared to the
prior year.
Cost of Services
Cost of services consists principally of costs for obtaining, transporting and testing specimens as well as facility costs
used for the delivery of our services.
Cost of services increased $20 million for the year ended December 31, 2015 compared to the prior year. This
increase was primarily driven by the additional operating costs associated with our acquisitions and, to a lesser extent, higher
compensation and benefits and higher restructuring and integration charges, which were partially offset by the impact of our
disposition (the Clinical Trials Contribution) on operating costs and net cost reductions under the Invigorate program.
QUEST DIAGNOSTICS 2015 ANNUAL REPORT ON FORM 10-K