Quest Diagnostics 2015 Annual Report Download - page 94
Download and view the complete annual report
Please find page 94 of the 2015 Quest Diagnostics annual report below. You can navigate through the pages in the report by either clicking on the pages listed below, or by using the keyword search tool below to find specific information within the annual report.-
 1
1 -
2
-
3
-
4
-
5
-
6
-
7
-
8
-
9
-
10
-
11
-
12
-
13
-
14
-
15
-
16
-
17
-
18
-
19
-
20
-
21
-
22
-
23
-
24
-
25
-
26
-
27
-
28
-
29
-
30
-
31
-
32
-
33
-
34
-
35
-
36
-
37
-
38
-
39
-
40
-
41
-
42
-
43
-
44
-
45
-
46
-
47
-
48
-
49
-
50
-
51
-
52
-
53
-
54
-
55
-
56
-
57
-
58
-
59
-
60
-
61
-
62
-
63
-
64
-
65
-
66
-
67
-
68
-
69
-
70
-
71
-
72
-
73
-
74
-
75
-
76
-
77
-
78
-
79
-
80
-
81
-
82
-
83
-
 84
84 -
 85
85 -
 86
86 -
 87
87 -
 88
88 -
 89
89 -
 90
90 -
 91
91 -
 92
92 -
 93
93 -
 94
94 -
 95
95 -
 96
96 -
 97
97 -
 98
98 -
 99
99 -
 100
100 -
 101
101 -
 102
102 -
 103
103 -
 104
104 -
105
-
106
-
107
-
108
-
109
-
110
-
111
-
112
-
113
-
114
-
115
-
116
-
117
-
118
-
119
-
120
-
121
-
122
-
123
-
124
-
125
-
126
-
127
-
128
-
129
 |
 |

QUEST DIAGNOSTICS INCORPORATED AND SUBSIDIARIES
NOTES TO CONSOLIDATED FINANCIAL STATEMENTS – CONTINUED
(in millions unless otherwise indicated)
F- 19
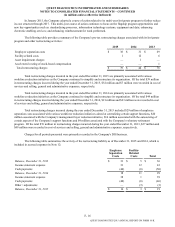
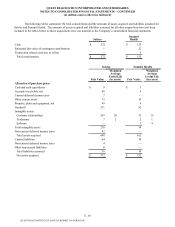
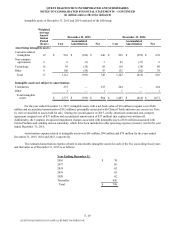
The following tables summarize the total consideration and the amounts of assets acquired and liabilities assumed for
Solstas and Summit Health. The amounts of assets acquired and liabilities assumed for all other acquisitions have not been
included in the tables below as these acquisitions were not material to the Company’s consolidated financial statements.
Solstas Summit
Health
Cash $ 572 $ 125
Estimated fair value of contingent consideration — 22
Transaction related costs due to sellers — 5
Total consideration $ 572 $ 152
Solstas Summit Health
Fair Value
Weighted
Average
Useful Life
(in years) Fair Value
Weighted
Average
Useful Life
(in years)
Allocation of purchase price:
Cash and cash equivalents $ 9 $ 1
Accounts receivable, net 48 9
Current deferred income taxes 7 —
Other current assets 12 16
Property, plant and equipment, net 49 6
Goodwill 271 92
Intangible assets:
Customer relationships 203 20 33 15
Tradename 7 2 2 1
Software — 3 4
Total intangible assets 210 38
Non-current deferred income taxes 42 —
Total assets acquired 648 162
Current liabilities 64 10
Non-current deferred income taxes 4 —
Other non-current liabilities 8 —
Total liabilities assumed 76 10
Net assets acquired $ 572 $ 152
QUEST DIAGNOSTICS 2015 ANNUAL REPORT ON FORM 10-K