Quest Diagnostics 2015 Annual Report Download - page 52
Download and view the complete annual report
Please find page 52 of the 2015 Quest Diagnostics annual report below. You can navigate through the pages in the report by either clicking on the pages listed below, or by using the keyword search tool below to find specific information within the annual report.-
 1
1 -
2
-
3
-
4
-
5
-
6
-
7
-
8
-
9
-
10
-
11
-
12
-
13
-
14
-
15
-
16
-
17
-
18
-
19
-
20
-
21
-
22
-
23
-
24
-
25
-
26
-
27
-
28
-
29
-
30
-
31
-
32
-
33
-
34
-
35
-
36
-
37
-
38
-
39
-
40
-
41
-
 42
42 -
 43
43 -
 44
44 -
 45
45 -
 46
46 -
 47
47 -
 48
48 -
 49
49 -
 50
50 -
 51
51 -
 52
52 -
 53
53 -
 54
54 -
 55
55 -
 56
56 -
 57
57 -
 58
58 -
 59
59 -
 60
60 -
 61
61 -
 62
62 -
63
-
64
-
65
-
66
-
67
-
68
-
69
-
70
-
71
-
72
-
73
-
74
-
75
-
76
-
77
-
78
-
79
-
80
-
81
-
82
-
83
-
84
-
85
-
86
-
87
-
88
-
89
-
90
-
91
-
92
-
93
-
94
-
95
-
96
-
97
-
98
-
99
-
100
-
101
-
102
-
103
-
104
-
105
-
106
-
107
-
108
-
109
-
110
-
111
-
112
-
113
-
114
-
115
-
116
-
117
-
118
-
119
-
120
-
121
-
122
-
123
-
124
-
125
-
126
-
127
-
128
-
129
 |
 |

48
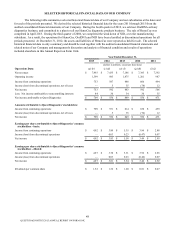
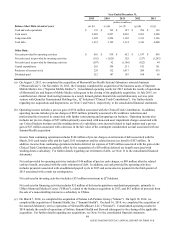
SELECTED HISTORICAL FINANCIAL DATA OF OUR COMPANY
The following table summarizes selected historical financial data of our Company and our subsidiaries at the dates and
for each of the periods presented. We derived the selected historical financial data for the years 2011 through 2015 from the
audited consolidated financial statements of our Company. During the fourth quarter of 2012, we sold our OralDNA salivary
diagnostics business, and committed to a plan to sell our HemoCue diagnostic products business. The sale of HemoCue was
completed in April 2013. During the third quarter of 2006, we completed the wind down of NID, a test kit manufacturing
subsidiary. As a result, the operations for HemoCue, OralDNA and NID have been classified as discontinued operations for all
periods presented. At December 31, 2012, the assets and liabilities of HemoCue were reported as held for sale. The selected
historical financial data is only a summary and should be read together with the audited consolidated financial statements and
related notes of our Company and management's discussion and analysis of financial condition and results of operations
included elsewhere in this Annual Report on Form 10-K.
Year Ended December 31,
2015 2014 2013 2012 2011
(dollars in millions, except per share data)
Operations Data: (a) (b) (c) (d) (e) (f) (g) (h) (i) (j)
Net revenues $ 7,493 $ 7,435 $ 7,146 $ 7,383 $ 7,392
Operating income 1,399 983 1,475 1,201 987
Income from continuing operations 753 587 848 666 494
Income (loss) from discontinued operations, net of taxes — 5 35 (74) 12
Net income 753 592 883 592 506
Less: Net income attributable to noncontrolling interests 44 36 34 36 35
Net income attributable to Quest Diagnostics $ 709 $ 556 $ 849 $ 556 $ 471
Amounts attributable to Quest Diagnostics' stockholders:
Income from continuing operations $ 709 $ 551 $ 814 $ 630 $ 459
Income (loss) from discontinued operations, net of taxes — 5 35 (74) 12
Net income $ 709 $ 556 $ 849 $ 556 $ 471
Earnings per share attributable to Quest Diagnostics' common
stockholders - basic:
Income from continuing operations $ 4.92 $ 3.80 $ 5.35 $ 3.96 $ 2.88
Income (loss) from discontinued operations — 0.03 0.23 (0.47) 0.07
Net income $ 4.92 $ 3.83 $ 5.58 $ 3.49 $ 2.95
Earnings per share attributable to Quest Diagnostics' common
stockholders - diluted:
Income from continuing operations $ 4.87 $ 3.78 $ 5.31 $ 3.92 $ 2.85
Income (loss) from discontinued operations — 0.03 0.23 (0.46) 0.07
Net income $ 4.87 $ 3.81 $ 5.54 $ 3.46 $ 2.92
Dividends per common share $ 1.52 $ 1.32 $ 1.20 $ 0.81 $ 0.47
QUEST DIAGNOSTICS 2015 ANNUAL REPORT ON FORM 10-K