Quest Diagnostics 2015 Annual Report Download - page 71
Download and view the complete annual report
Please find page 71 of the 2015 Quest Diagnostics annual report below. You can navigate through the pages in the report by either clicking on the pages listed below, or by using the keyword search tool below to find specific information within the annual report.-
 1
1 -
2
-
3
-
4
-
5
-
6
-
7
-
8
-
9
-
10
-
11
-
12
-
13
-
14
-
15
-
16
-
17
-
18
-
19
-
20
-
21
-
22
-
23
-
24
-
25
-
26
-
27
-
28
-
29
-
30
-
31
-
32
-
33
-
34
-
35
-
36
-
37
-
38
-
39
-
40
-
41
-
42
-
43
-
44
-
45
-
46
-
47
-
48
-
49
-
50
-
51
-
52
-
53
-
54
-
55
-
56
-
57
-
58
-
59
-
60
-
 61
61 -
 62
62 -
 63
63 -
 64
64 -
 65
65 -
 66
66 -
 67
67 -
 68
68 -
 69
69 -
 70
70 -
 71
71 -
 72
72 -
 73
73 -
 74
74 -
 75
75 -
 76
76 -
 77
77 -
 78
78 -
 79
79 -
 80
80 -
 81
81 -
82
-
83
-
84
-
85
-
86
-
87
-
88
-
89
-
90
-
91
-
92
-
93
-
94
-
95
-
96
-
97
-
98
-
99
-
100
-
101
-
102
-
103
-
104
-
105
-
106
-
107
-
108
-
109
-
110
-
111
-
112
-
113
-
114
-
115
-
116
-
117
-
118
-
119
-
120
-
121
-
122
-
123
-
124
-
125
-
126
-
127
-
128
-
129
 |
 |

67
things, the enterprises’ ability to raise additional capital or derive cash inflows from continuing operations or through liquidity
events such as initial public offerings, mergers or private sales.
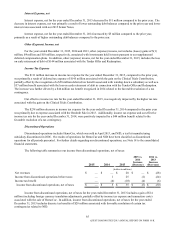
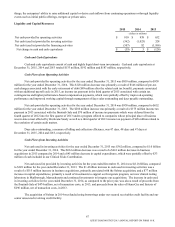
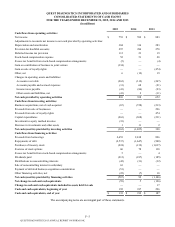
Liquidity and Capital Resources
2015 2014 2013
(dollars in millions)
Net cash provided by operating activities $ 810 $ 938 $ 652
Net cash (used in) provided by investing activities (362)(1,025) 328
Net cash (used in) provided by financing activities (507) 92 (1,106)
Net change in cash and cash equivalents $ (59) $ 5 $ (126)
Cash and Cash Equivalents
Cash and cash equivalents consist of cash and highly liquid short-term investments. Cash and cash equivalents at
December 31, 2015, 2014 and 2013 totaled $133 million, $192 million and $187 million, respectively.
Cash Flows from Operating Activities
Net cash provided by operating activities for the year ended December 31, 2015 was $810 million, compared to $938
million for the year ended December 31, 2014. This $128 million decrease was primarily a result of $146 million of pre-tax
cash charges associated with the early retirement of debt ($89 million after the related cash tax benefit), payments associated
with an additional payroll cycle in 2015, an income tax payment in the third quarter of 2015 associated with certain tax
contingencies and higher performance-based compensation payments, which were partially offset by improved operating
performance and improved working capital through management of days sales outstanding and days payable outstanding.
Net cash provided by operating activities for the year ended December 31, 2014 was $938 million, compared to $652
million for the year ended December 31, 2013. The $286 million increase was primarily a result of a $175 million income tax
payment in 2013 associated with the Ibrutinib Sale and $70 million of income tax payments which were deferred from the
fourth quarter of 2012 into the first quarter of 2013 under a program offered to companies whose principal place of business
was in states most affected by Hurricane Sandy as well as a third quarter of 2013 income tax payment of $28 million related to
the resolution of certain audit matters.
Days sales outstanding, a measure of billing and collection efficiency, was 47 days, 48 days and 47 days at
December 31, 2015, 2014 and 2013, respectively.
Cash Flows from Investing Activities
Net cash used in investing activities for the year ended December 31, 2015 was $362 million, compared to $1.0 billion
for the year ended December 31, 2014. This $663 million decrease was a result of a $661 million decrease in business
acquisitions in 2015 compared to 2014 and a $45 million decrease in capital expenditures, which were partially offset by $33
million of cash included in our Clinical Trials Contribution.
Net cash (used in) provided by investing activities for the year ended December 31, 2014 was $(1.0) billion, compared
to $328 million for the year ended December 31, 2013. The $1.4 billion increase in cash used in investing activities was a
result of a $515 million increase in business acquisitions, primarily associated with the Solstas acquisition, and a $77 million
increase in capital expenditures, primarily a result of investments to support our Invigorate program, our new clinical testing
laboratory in Marlborough, Massachusetts and continued investments to integrate our acquisitions. The increase in cash used
in investing activities for the year ended December 31, 2014, as compared to the prior year, was also a result of proceeds from
the Ibrutinib Sale of $474 million, net of transaction costs, in 2013, and proceeds from the sales of HemoCue and Enterix of
$296 million, net of transaction costs, in 2013.
The acquisition of Solstas in 2014 was funded using borrowings under our secured receivables credit facility and our
senior unsecured revolving credit facility.
QUEST DIAGNOSTICS 2015 ANNUAL REPORT ON FORM 10-K