Quest Diagnostics 2015 Annual Report Download - page 90
Download and view the complete annual report
Please find page 90 of the 2015 Quest Diagnostics annual report below. You can navigate through the pages in the report by either clicking on the pages listed below, or by using the keyword search tool below to find specific information within the annual report.-
 1
1 -
2
-
3
-
4
-
5
-
6
-
7
-
8
-
9
-
10
-
11
-
12
-
13
-
14
-
15
-
16
-
17
-
18
-
19
-
20
-
21
-
22
-
23
-
24
-
25
-
26
-
27
-
28
-
29
-
30
-
31
-
32
-
33
-
34
-
35
-
36
-
37
-
38
-
39
-
40
-
41
-
42
-
43
-
44
-
45
-
46
-
47
-
48
-
49
-
50
-
51
-
52
-
53
-
54
-
55
-
56
-
57
-
58
-
59
-
60
-
61
-
62
-
63
-
64
-
65
-
66
-
67
-
68
-
69
-
70
-
71
-
72
-
73
-
74
-
75
-
76
-
77
-
78
-
79
-
 80
80 -
 81
81 -
 82
82 -
 83
83 -
 84
84 -
 85
85 -
 86
86 -
 87
87 -
 88
88 -
 89
89 -
 90
90 -
 91
91 -
 92
92 -
 93
93 -
 94
94 -
 95
95 -
 96
96 -
 97
97 -
 98
98 -
 99
99 -
 100
100 -
101
-
102
-
103
-
104
-
105
-
106
-
107
-
108
-
109
-
110
-
111
-
112
-
113
-
114
-
115
-
116
-
117
-
118
-
119
-
120
-
121
-
122
-
123
-
124
-
125
-
126
-
127
-
128
-
129
 |
 |

QUEST DIAGNOSTICS INCORPORATED AND SUBSIDIARIES
NOTES TO CONSOLIDATED FINANCIAL STATEMENTS – CONTINUED
(in millions unless otherwise indicated)
F- 15
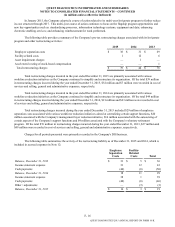
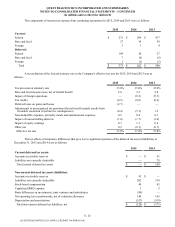
3. EARNINGS PER SHARE
The computation of basic and diluted earnings per common share is as follows (in millions, except per share data):
2015 2014 2013
Amounts attributable to Quest Diagnostics’ stockholders:
Income from continuing operations $ 709 $ 551 $ 814
Income from discontinued operations, net of taxes — 5 35
Net income attributable to Quest Diagnostics’ common stockholders $ 709 $ 556 $ 849
Income from continuing operations $ 709 $ 551 $ 814
Less: Earnings allocated to participating securities 3 2 3
Earnings available to Quest Diagnostics’ common stockholders – basic and
diluted $ 706 $ 549 $ 811
Weighted average common shares outstanding – basic 144 145 152
Effect of dilutive securities:
Stock options and performance share units 1 — 1
Weighted average common shares outstanding – diluted 145 145 153
Earnings per share attributable to Quest Diagnostics’ common
stockholders – basic:
Income from continuing operations $ 4.92 $ 3.80 $ 5.35
Income from discontinued operations — 0.03 0.23
Net income $ 4.92 $ 3.83 $ 5.58
Earnings per share attributable to Quest Diagnostics’ common
stockholders – diluted:
Income from continuing operations $ 4.87 $ 3.78 $ 5.31
Income from discontinued operations — 0.03 0.23
Net income $ 4.87 $ 3.81 $ 5.54
The following securities were not included in the calculation of diluted earnings per share due to their antidilutive
effect:
2015 2014 2013
Stock options and performance share units 2 2 1
4. RESTRUCTURING ACTIVITIES
Invigorate Program
During 2012, the Company committed to a course of action related to a multi-year program called Invigorate which is
designed to reduce its cost structure. Invigorate has consisted of several flagship programs, with structured plans in each, to
drive savings and improve performance across the customer value chain. These flagship programs include: organization
excellence; information technology excellence; procurement excellence; service excellence; lab excellence; and billing
excellence. From 2012 through 2014, the Invigorate program was intended to partially offset reimbursement pressures and
labor and benefit cost increases; free up additional resources to invest in science, innovation and other growth initiatives; and
enable us to improve service quality and operating profitability.
QUEST DIAGNOSTICS 2015 ANNUAL REPORT ON FORM 10-K