Quest Diagnostics 2015 Annual Report Download - page 118
Download and view the complete annual report
Please find page 118 of the 2015 Quest Diagnostics annual report below. You can navigate through the pages in the report by either clicking on the pages listed below, or by using the keyword search tool below to find specific information within the annual report.-
 1
1 -
2
-
3
-
4
-
5
-
6
-
7
-
8
-
9
-
10
-
11
-
12
-
13
-
14
-
15
-
16
-
17
-
18
-
19
-
20
-
21
-
22
-
23
-
24
-
25
-
26
-
27
-
28
-
29
-
30
-
31
-
32
-
33
-
34
-
35
-
36
-
37
-
38
-
39
-
40
-
41
-
42
-
43
-
44
-
45
-
46
-
47
-
48
-
49
-
50
-
51
-
52
-
53
-
54
-
55
-
56
-
57
-
58
-
59
-
60
-
61
-
62
-
63
-
64
-
65
-
66
-
67
-
68
-
69
-
70
-
71
-
72
-
73
-
74
-
75
-
76
-
77
-
78
-
79
-
80
-
81
-
82
-
83
-
84
-
85
-
86
-
87
-
88
-
89
-
90
-
91
-
92
-
93
-
94
-
95
-
96
-
97
-
98
-
99
-
100
-
101
-
102
-
103
-
104
-
105
-
106
-
107
-
 108
108 -
 109
109 -
 110
110 -
 111
111 -
 112
112 -
 113
113 -
 114
114 -
 115
115 -
 116
116 -
 117
117 -
 118
118 -
 119
119 -
 120
120 -
 121
121 -
 122
122 -
 123
123 -
 124
124 -
 125
125 -
 126
126 -
 127
127 -
 128
128 -
129
 |
 |

QUEST DIAGNOSTICS INCORPORATED AND SUBSIDIARIES
NOTES TO CONSOLIDATED FINANCIAL STATEMENTS – CONTINUED
(in millions unless otherwise indicated)
F- 43
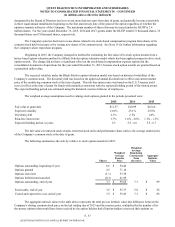
the sale of the ibrutinib royalty rights and the pre-tax loss on the sale of Enterix. The accounting policies of the segments are
the same as those of the Company as set forth in Note 2.
2015 2014 2013
Net revenues:
DIS business $ 6,965 $ 6,873 $ 6,587
All other operating segments 528 562 559
Total net revenues $ 7,493 $ 7,435 $ 7,146
Operating earnings (loss):
DIS business $ 1,118 $ 1,068 $ 1,201
All other operating segments 110 94 76
General corporate activities 171 (179) 198
Total operating income 1,399 983 1,475
Non-operating expenses, net (296)(160)(151)
Income from continuing operations before income taxes and equity in
earnings of equity method investees 1,103 823 1,324
Income tax expense (373)(262)(500)
Equity in earnings of equity method investees, net of taxes 23 26 24
Income from continuing operations 753 587 848
Income from discontinued operations, net of taxes — 5 35
Net income 753 592 883
Less: Net income attributable to noncontrolling interests 44 36 34
Net income attributable to Quest Diagnostics $ 709 $ 556 $ 849
2015 2014 2013
Depreciation and amortization:
DIS business $ 212 $ 206 $ 189
All other operating segments 10 13 12
General corporate 82 95 82
Total depreciation and amortization $ 304 $ 314 $ 283
Capital expenditures:
DIS business $ 243 $ 283 $ 196
All other operating segments 16 17 26
General corporate 4 8 9
Total capital expenditures $ 263 $ 308 $ 231
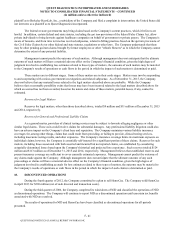
20. RELATED PARTIES
The Company's equity method investees primarily consist of its clinical trials central laboratory services joint venture
and its diagnostic information services joint ventures, which are accounted for under the equity method of accounting. During
the year ended December 31, 2015, the Company recognized net revenues of $30 million associated with diagnostic
information services provided to its equity method investees. As of December 31, 2015, there was $5 million of accounts
receivable from equity method investees on the consolidated balance sheet related to such services.
During the year ended December 31, 2015, the Company recognized $31 million of income associated with the
performance of certain corporate services, including transition services, for its equity method investees, classified within
selling, general and administrative expenses. As of December 31, 2015, there was $32 million of other receivables from equity
QUEST DIAGNOSTICS 2015 ANNUAL REPORT ON FORM 10-K